The nitrogen crisis mapped out
What are peak emitters, and what is the nitrogen problem? Explore our maps showing ammonia and nitrogen dioxide levels across Dutch municipalities and discover the largest sources of emissions.
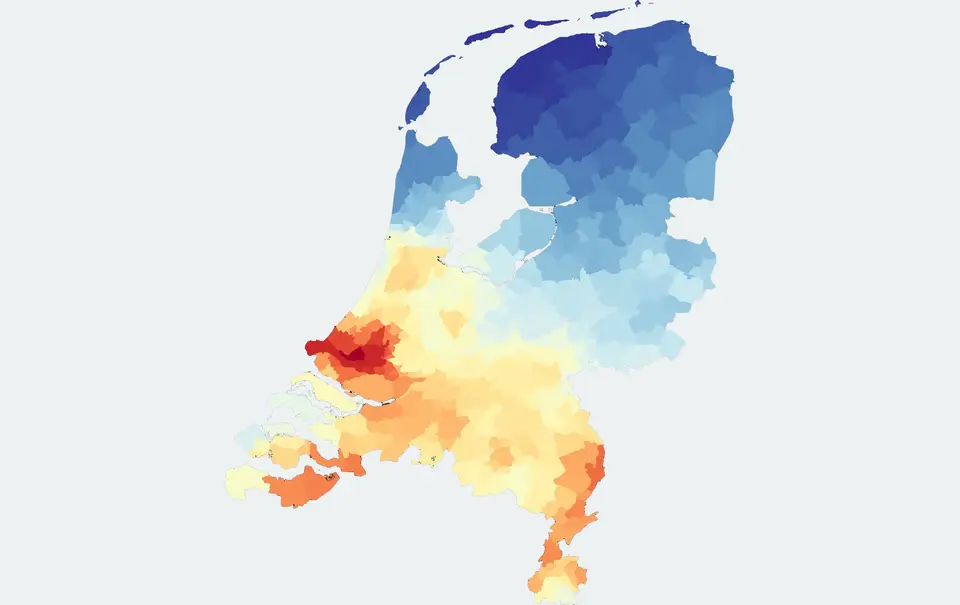
What exactly is a peak emitter? Where are they located, which companies are responsible, and how far are they from Natura 2000 areas? What do they emit, and in what quantities?
The government has introduced various measures to reduce nitrogen emissions. For example, in 2023, plans were announced to require the 50 industrial companies located near Natura 2000 areas to reduce their emissions. But which companies are they? We make these sources of pollution visible and accessible.
Top 50 industrial nitrogen emitters
According to the government's plans, the measures for the industrial sector were expected to be announced in early 2023. The aim was to demonstrate that industry could also contribute to reducing nitrogen emissions through more sustainable practices.
Alongside the agricultural sector, the industrial sector was also facing long-awaited requirements to reduce its nitrogen emissions, particularly nitrogen dioxide (NO₂).
Parliament takes action against major industrial emitters
The permits of approximately 50 of the largest industrial nitrogen emitters are to be tightened. The Dutch House of Representatives has called for government intervention.
This article highlights an interesting issue. One of the country's largest nitrogen emitters is buying out farms to create room for its own emissions to increase. Who wouldn't want to be at the top of the list?
Christianne van der Wal, then Minister for Nature and Nitrogen Policy, announced that the government would identify the top 50 industrial emitters starting in January. But who are these 50 companies? Or perhaps even 100?
It is important to understand where these companies are located, which businesses are responsible, and how far they are from Natura 2000 areas. These factors also help determine whether a company might appear on the initial list. Naturally, their emissions are equally important.
We have already mapped 100 major industrial emitters across the Netherlands. For each company, we show:
- Its distance from the nearest Natura 2000 area.
- Its reported emissions in 2019, according to the Dutch Emissions Registration.
- Its position in the top 100 ranking, based on 2019 emissions data.
How are peak emitters identified?
Identifying major nitrogen emitters requires an integrated approach that considers both nitrogen dioxide (NO₂) and ammonia (NH₃).
It is important to distinguish between emissions – where pollution originates – and concentrations – where pollutants are present and how they are distributed.
Only by combining source data with actual measurements can major emitters be identified accurately. As Johan Remkes stated in his report Wat kan wel (What Is Possible), assessments should not rely solely on nitrogen deposition figures. Emissions are an essential part of the equation.
Below, we discuss five important factors to consider when measuring nitrogen dioxide and ammonia.
1. Land area
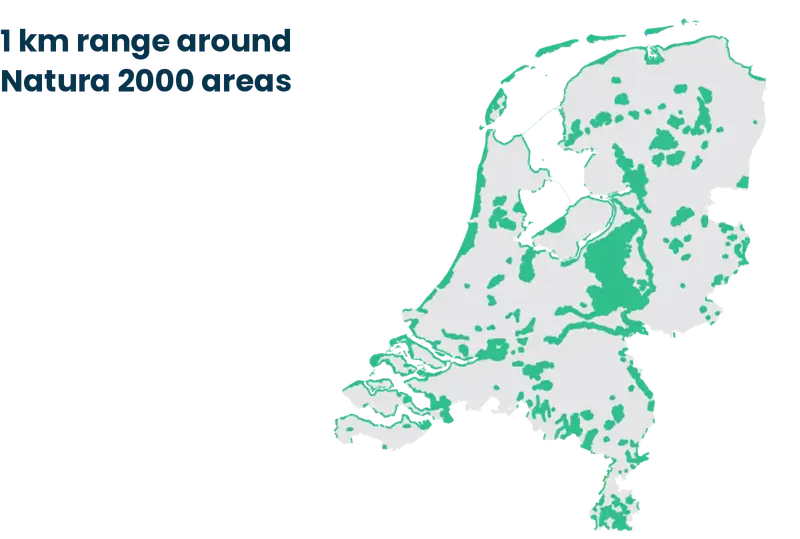
Five months earlier, the Ministry announced that nitrogen-emitting activities would no longer be permitted within a one-kilometre zone surrounding Natura 2000 areas.
This would mean that approximately 9,000 km² of the Netherlands' 33,000 km² land area would be subject to restrictions on NH₃ and NO₂ emissions.
By mapping these protected areas and linking them to the locations of industrial facilities, we can identify potential peak emitters.
2. Top 100 emission rankings
The largest emitters can be identified by combining measurements with data from the Dutch Emissions Registration.
A major emitter is not automatically a peak emitter, but emission rankings provide an important starting point for identifying potential contributors to nitrogen pollution.
Excess nitrogen threatens biodiversity in protected natural areas. Natura 2000 sites are particularly vulnerable, although other natural areas are affected as well.
Two Top 100 rankings are available, covering both NO₂ emissions and NH₃ emissions. These rankings can serve as a basis for identifying the largest emission sources.
On November 1, 2022, it became known that the RIVM rankings contained significant calculation errors. This further highlighted the importance of incorporating actual measurement data.
Caeli does not rely solely on the RIVM calculation methodology.
The accelerated reduction of nitrogen deposition and the transition towards more sustainable practices are also essential for major industrial emitters. This approach is being developed separately to ensure it aligns with existing policies and the specific characteristics of the industrial sector. The government intends to work with approximately 50 of the largest industrial peak emitters to tighten permits and accelerate sustainability efforts. Agreements were expected to be reached in 2023, resulting in substantial nitrogen reductions. The government will also announce preliminary nitrogen reduction targets for other sectors, including industry.
– Government of the Netherlands
3. Road traffic in the Netherlands
Road traffic is one of the major sources of nitrogen dioxide (NO₂) emissions.
Passenger cars in the Netherlands travel approximately 100 billion kilometres annually. Around 80% of these vehicles run on petrol and 11% on diesel.
According to the figures used in this analysis, an average petrol car emits 21 grams of NO₂, while a diesel car emits 365 grams.
This would amount to approximately 1.7 million tonnes of NO₂ from petrol cars and 4 million tonnes from diesel cars across the Netherlands.
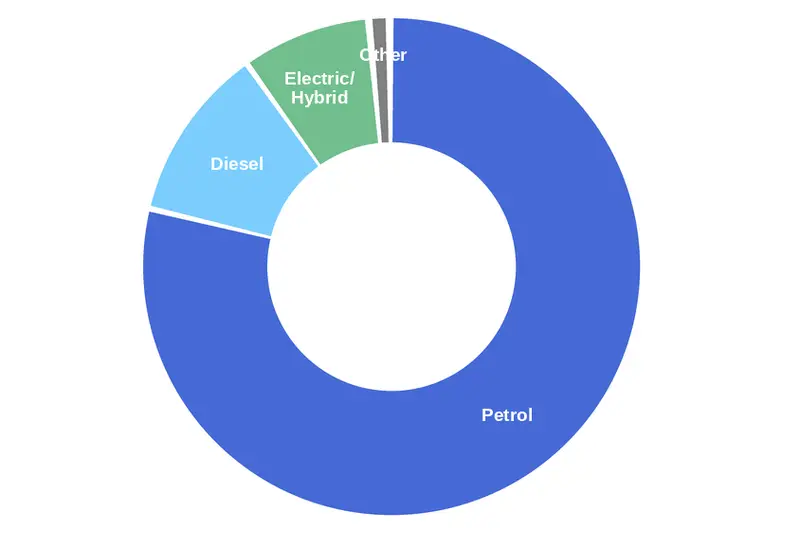
Passenger cars in the Netherlands by fuel type, 2022
When ranking Dutch municipalities, road traffic is an important contributing factor. As a result, major industrial emitters such as Tata Steel, Schiphol and Dow Chemical may appear less prominent in nationwide rankings.
However, when zooming in on their individual locations, these major industrial emission sources become much more visible.
4. Weather and wind data
Weather conditions play an important role in understanding nitrogen emissions.
Both NO₂ and NH₃ disperse through the surrounding environment after being released. By incorporating wind direction, wind speed, humidity and temperature into our algorithms, it becomes possible to better determine where emissions originate and how they spread.
This also makes it possible to identify which areas experience the greatest pollution exposure on a daily, monthly and annual basis.
The satellite data used by Caeli incorporates these weather influences to improve the accuracy of our analysis.
5. Real-time satellite data
Satellite data makes it possible to identify Dutch municipalities and provinces with the highest concentrations of NO₂ and NH₃.
These rankings can be established annually and subsequently monitored on a monthly basis using satellite observations.
By combining raw satellite data with advanced algorithms, we can translate large-scale measurements into insights at neighbourhood level. This makes it possible to map both emissions and pollutant concentrations across different areas.
In turn, this provides policymakers with better measurement data to support informed decisions and more effective environmental policies.
The most polluted municipalities in the Netherlands
The largest emission sources can be identified for each municipality.
The maps below show the average concentrations of nitrogen dioxide and ammonia across Dutch municipalities in 2021.