A healthier environment starts with air quality insight
Caeli AQM turns satellite observations into validated maps of NO₂ and particulate matter per neighbourhood. Useful for environmental policy, clean air agreements and the EU limit values toward 2030.
Municipalities and provinces that work with Caeli






Insight
Air quality down to neighbourhood level
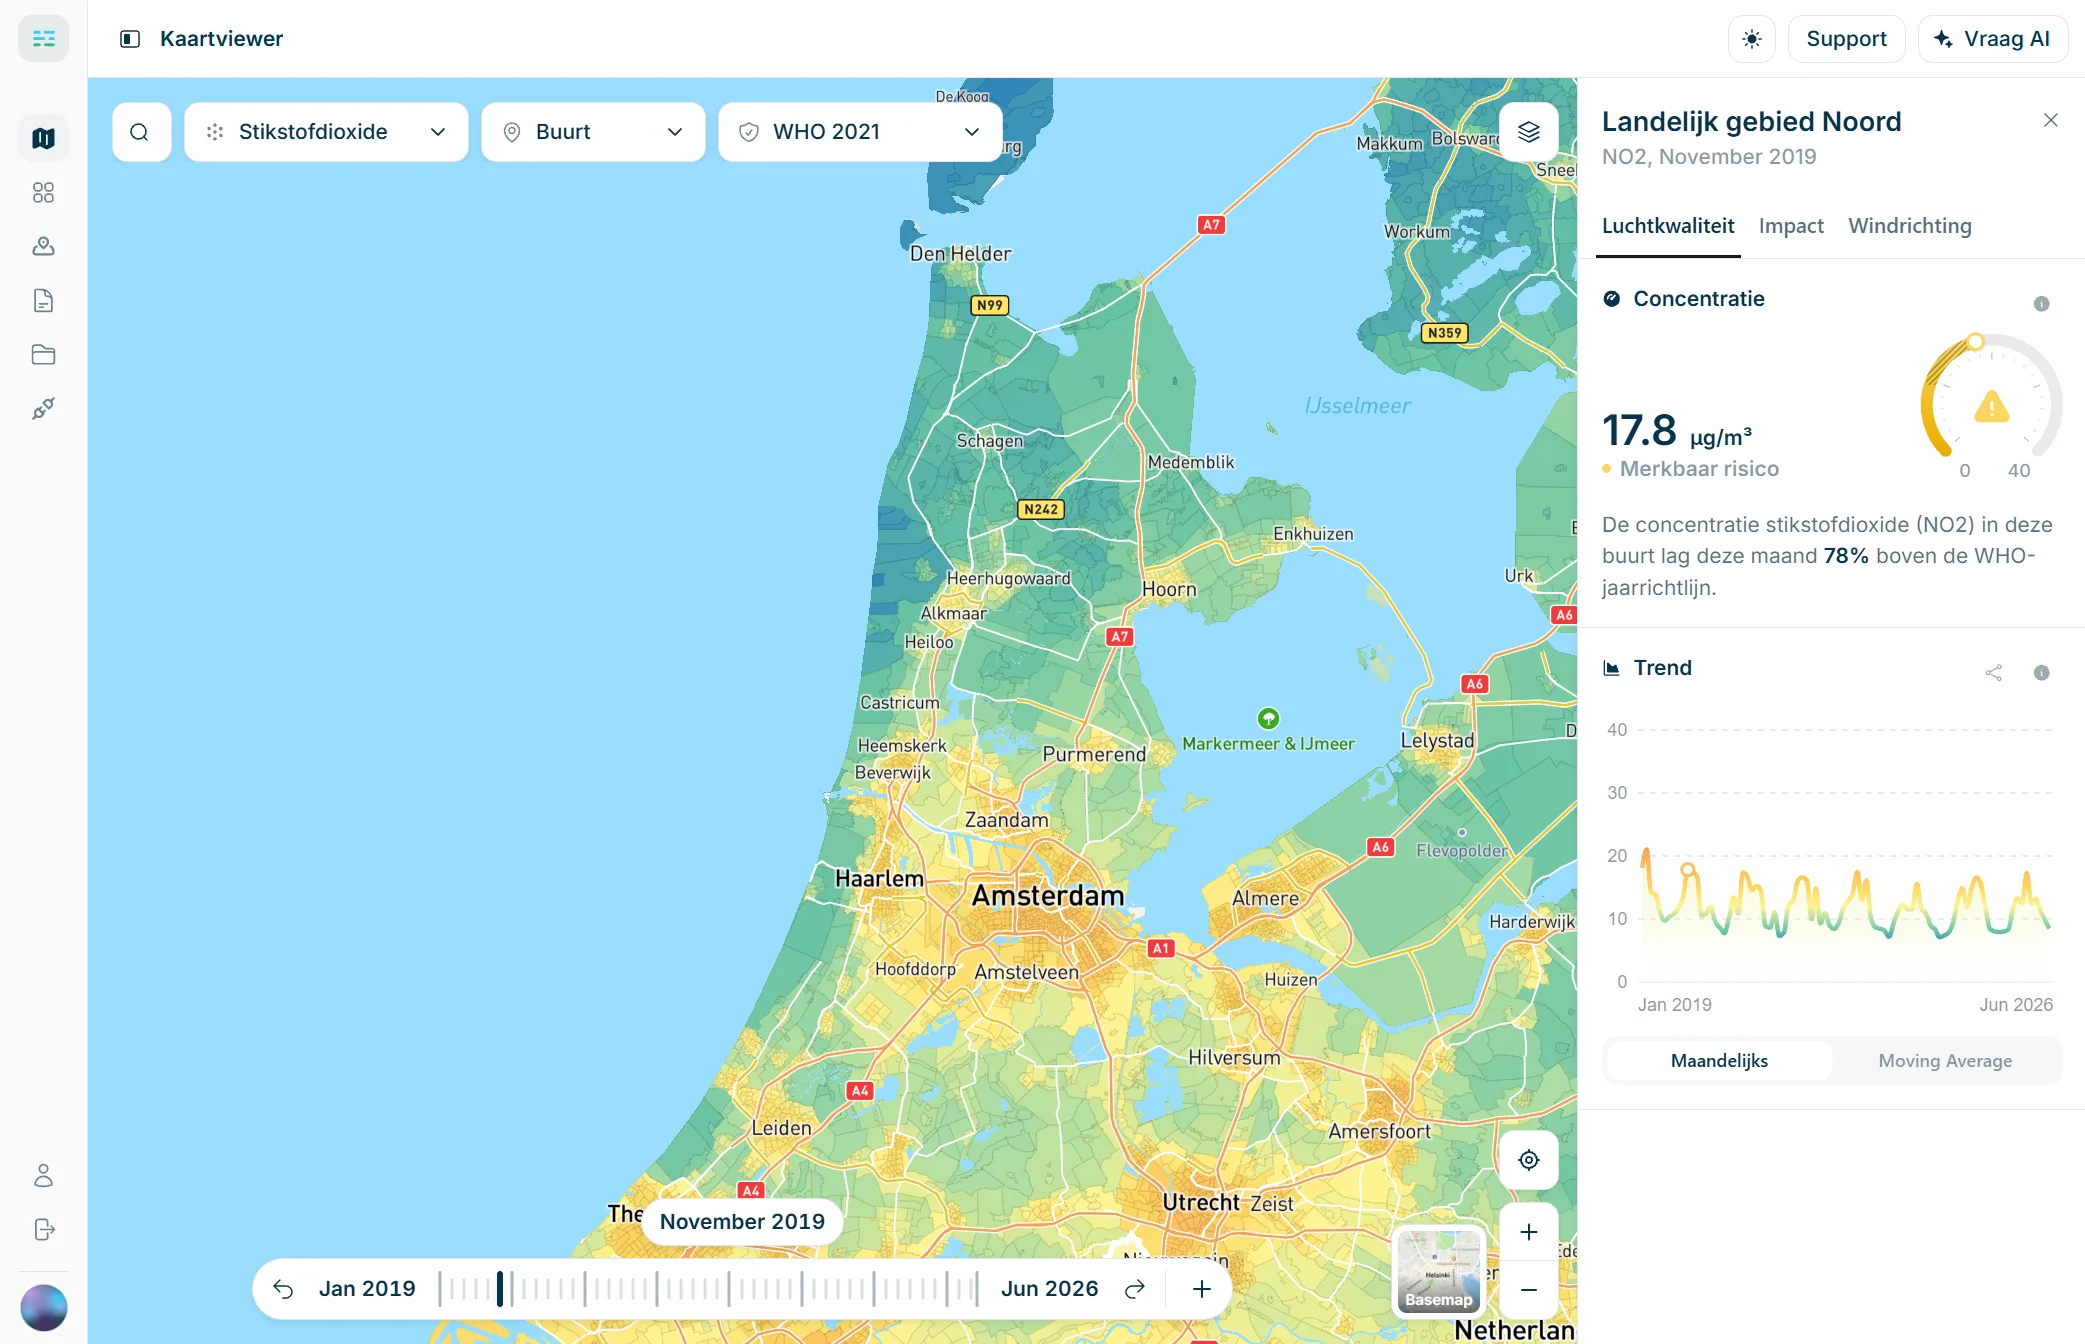
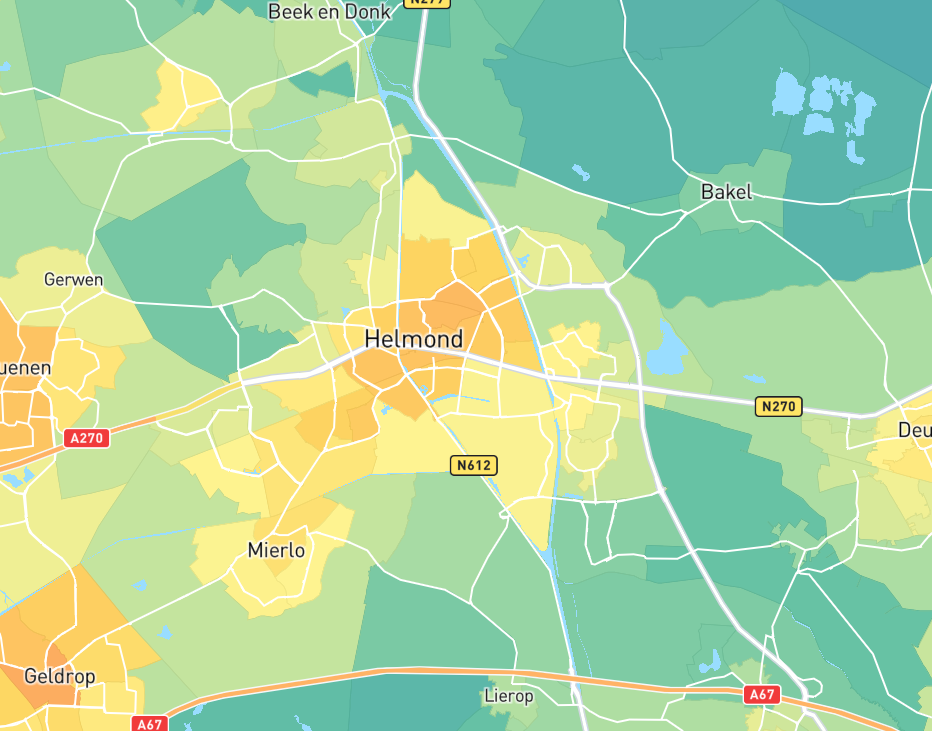
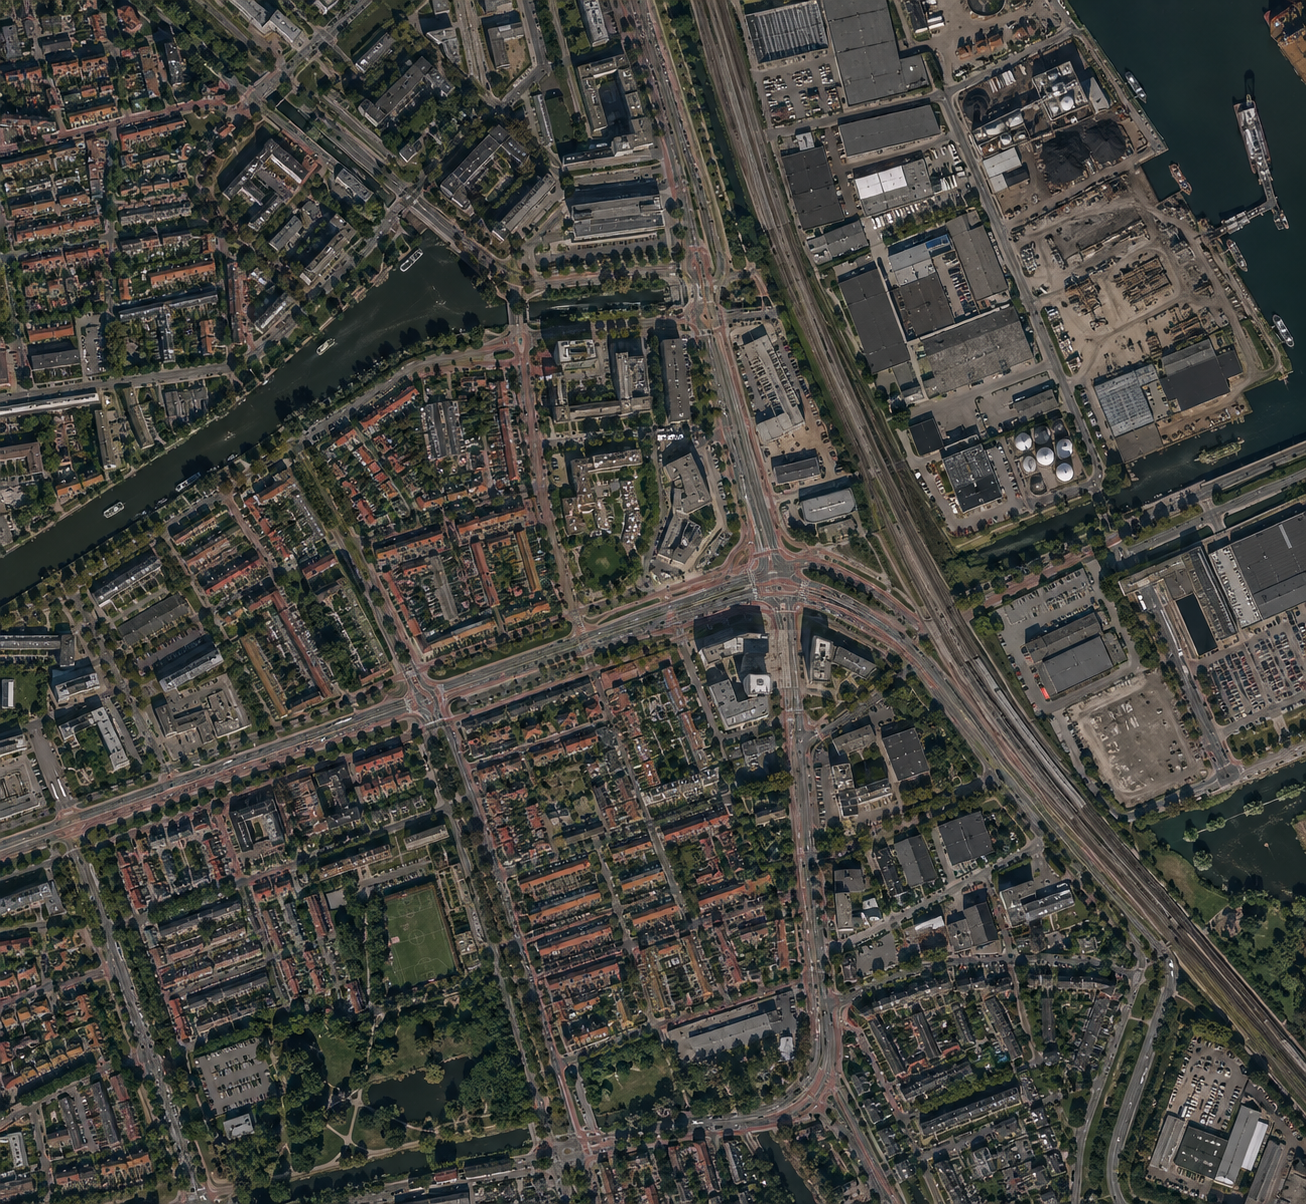
Ground monitoring stations do not cover every neighbourhood. AQM fills that gap with satellite observations validated against ground measurements, so you see NO₂, particulate matter and other indicators with area-wide coverage. Down to neighbourhood level, available as maps and time series in the dashboard and via the API.
- Historical data from 2019
- Nationwide coverage without your own monitoring network
- Ready to use via dashboard and API
Health
Link air quality to sensitive locations
Coalition agreements promise a healthy living environment, but without an exposure picture that stays abstract. AQM links concentrations per neighbourhood to sensitive locations such as schools and care sites. You see where vulnerable groups face the highest pressure, and where health gains and measures deliver the most for spatial plans and public-health advice.
- Sensitive locations in view
- Prioritise neighbourhoods with the highest exposure
- Underpin health policy with facts
Monitoring
Follow how air quality develops
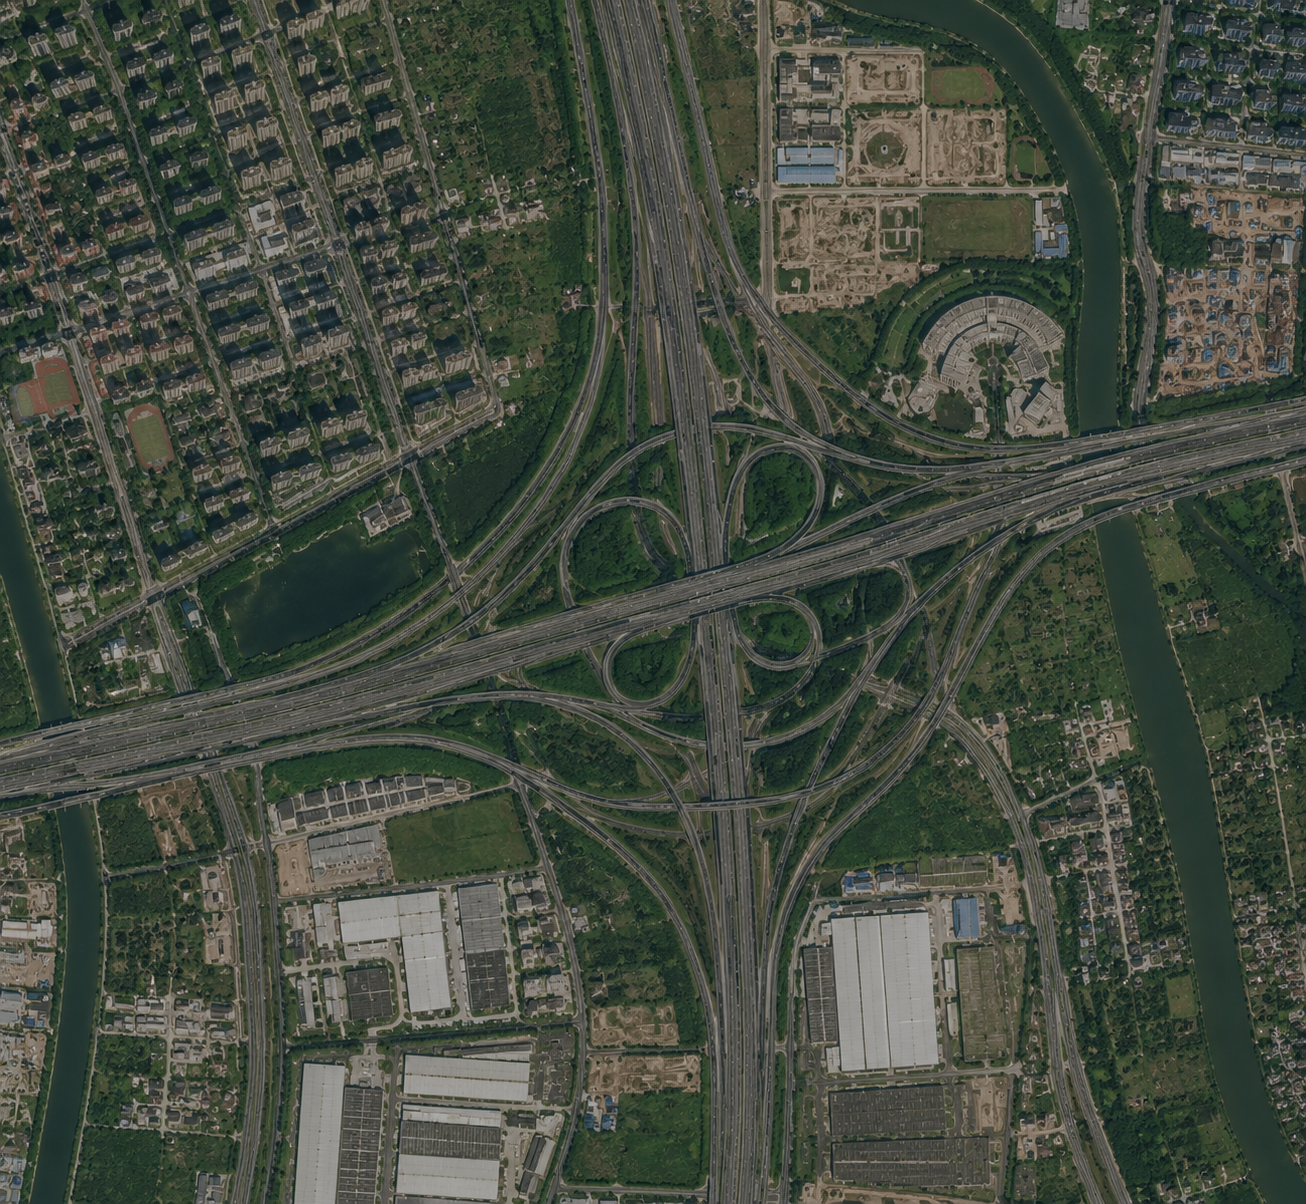
With history from 2019 you compare neighbourhoods and years on one method. See whether zero-emission zones, mobility measures or wood-stove policy show up in the concentrations, and check the direction toward stricter EU limit values from 2030 and WHO guideline values. Suitable for annual progress, council reporting and the conversation about a possible roadmap.
- See the effect of measures
- Assess against EU standards and WHO guidance
Reporting
From maps and figures to a clear report
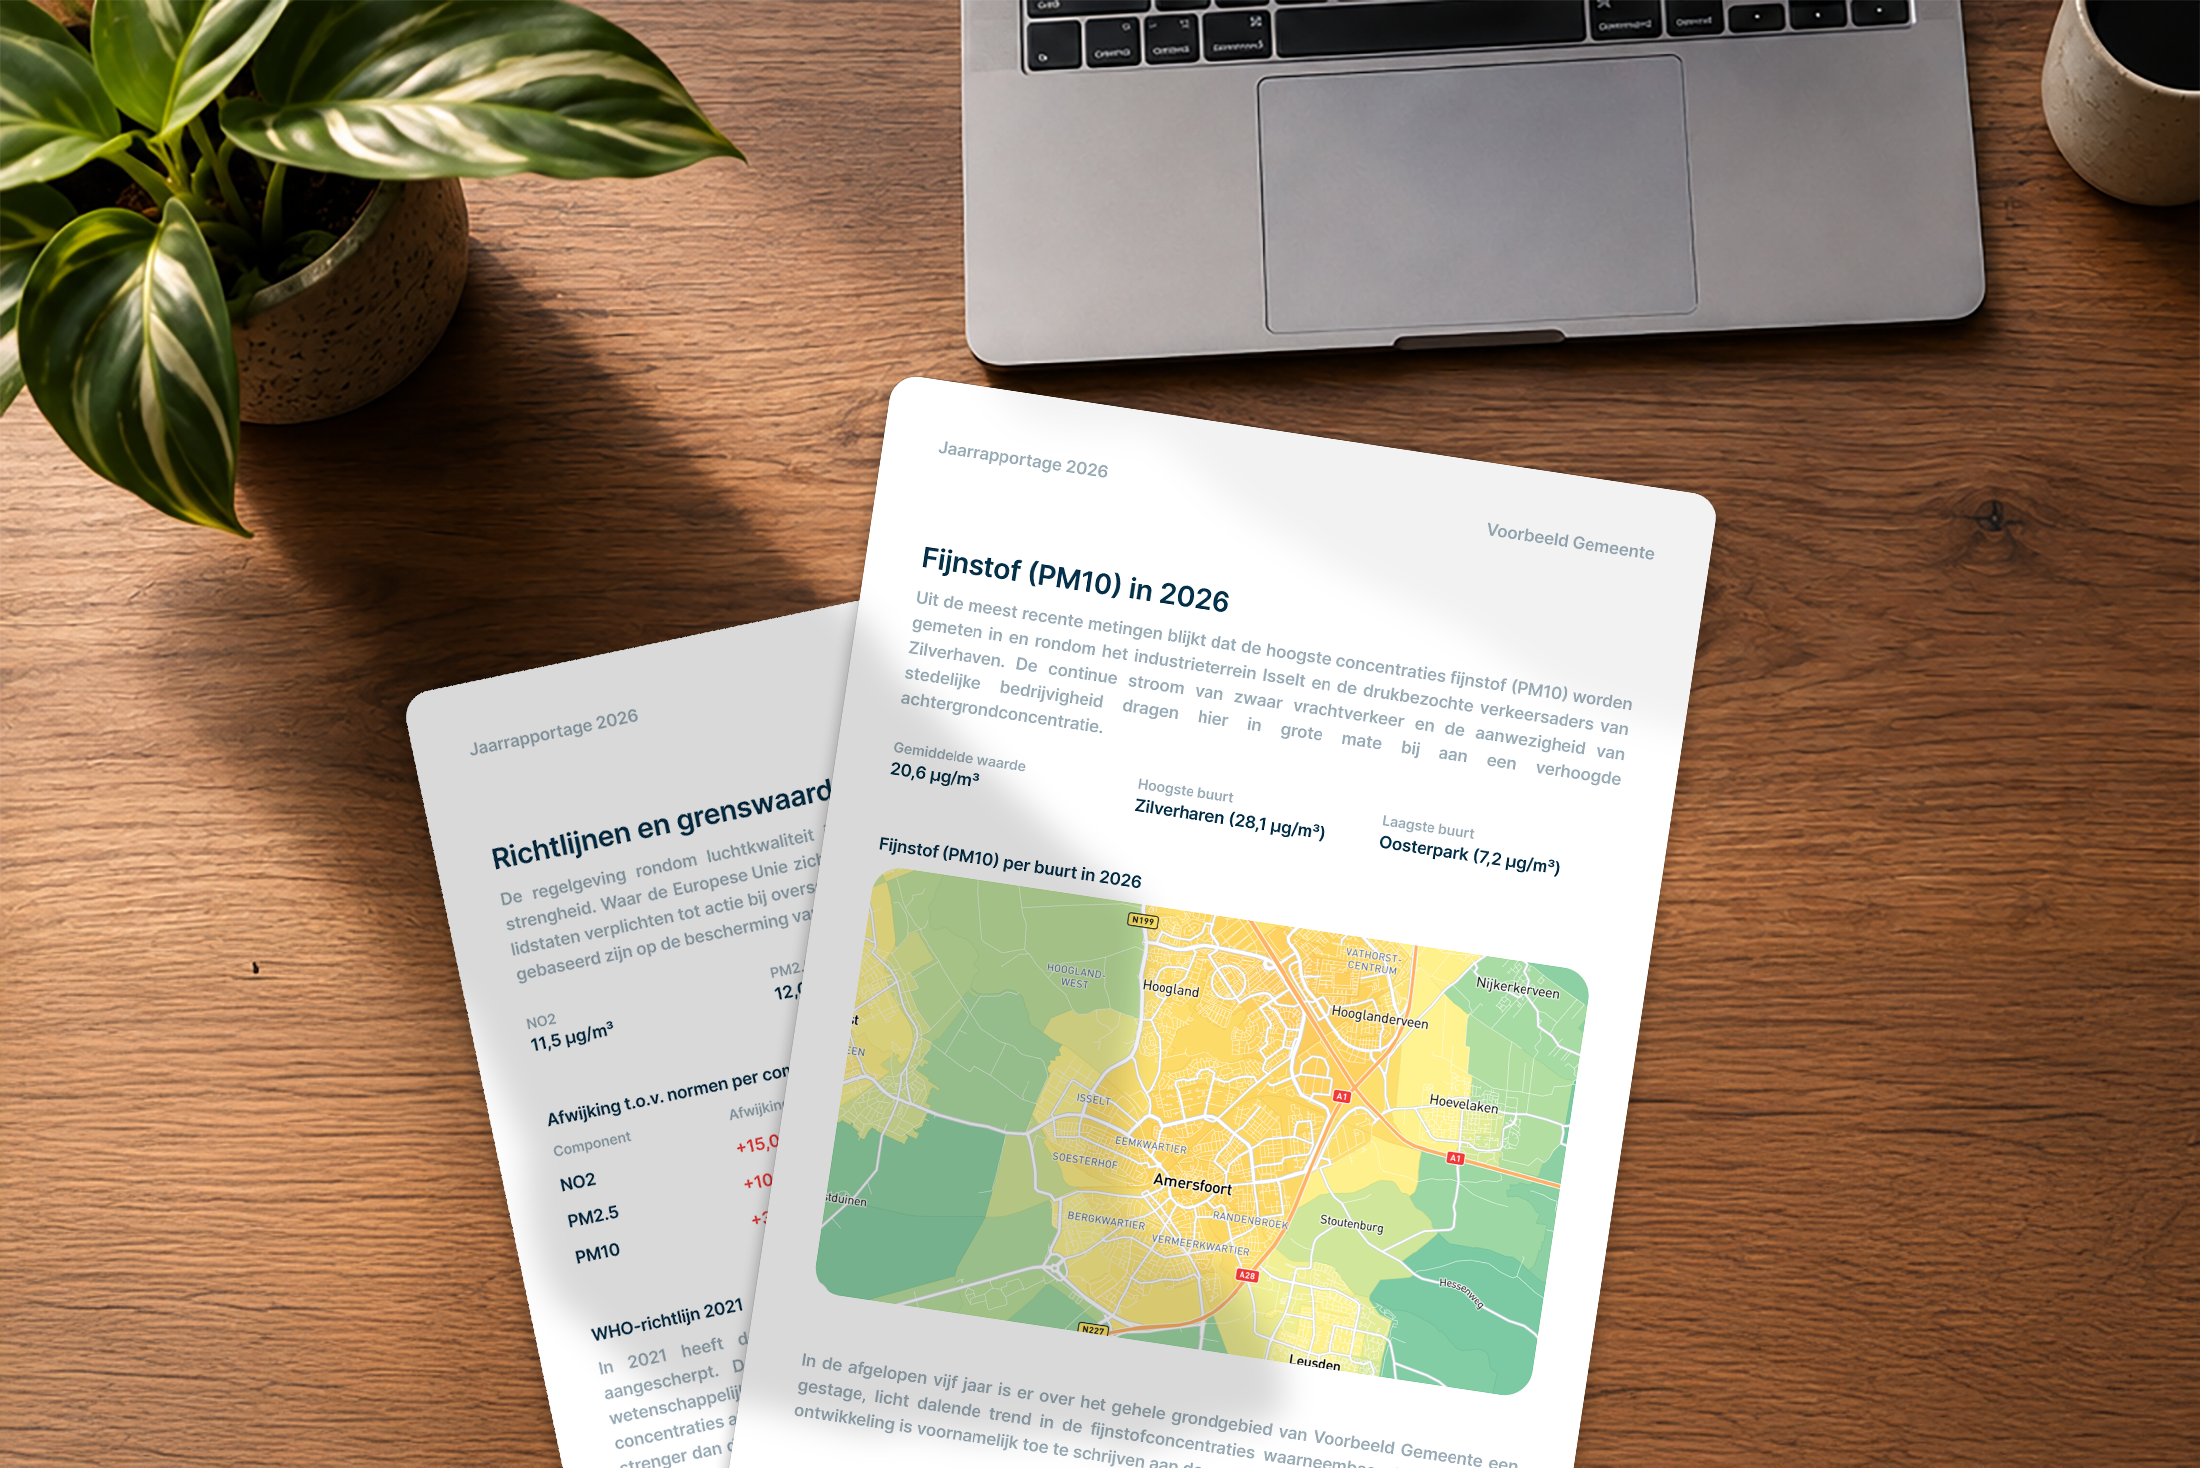
Pull maps, trends and limit-value checks straight from the dashboard. No loose analysis sheets: you assemble overviews that fit council briefings, clean-air progress or regional talks, and share them with leadership and partners.
- Export maps and figures in a few steps
- Overviews ready for council and inspection
- Same method, comparable year after year
Solutions
Put the Air Quality Monitor to work in your municipality
A fixed package for Dutch municipalities up to 50,000 inhabitants. Above that, a tailored proposal.
These municipalities already use Caeli
Documentation
Read more about AQM
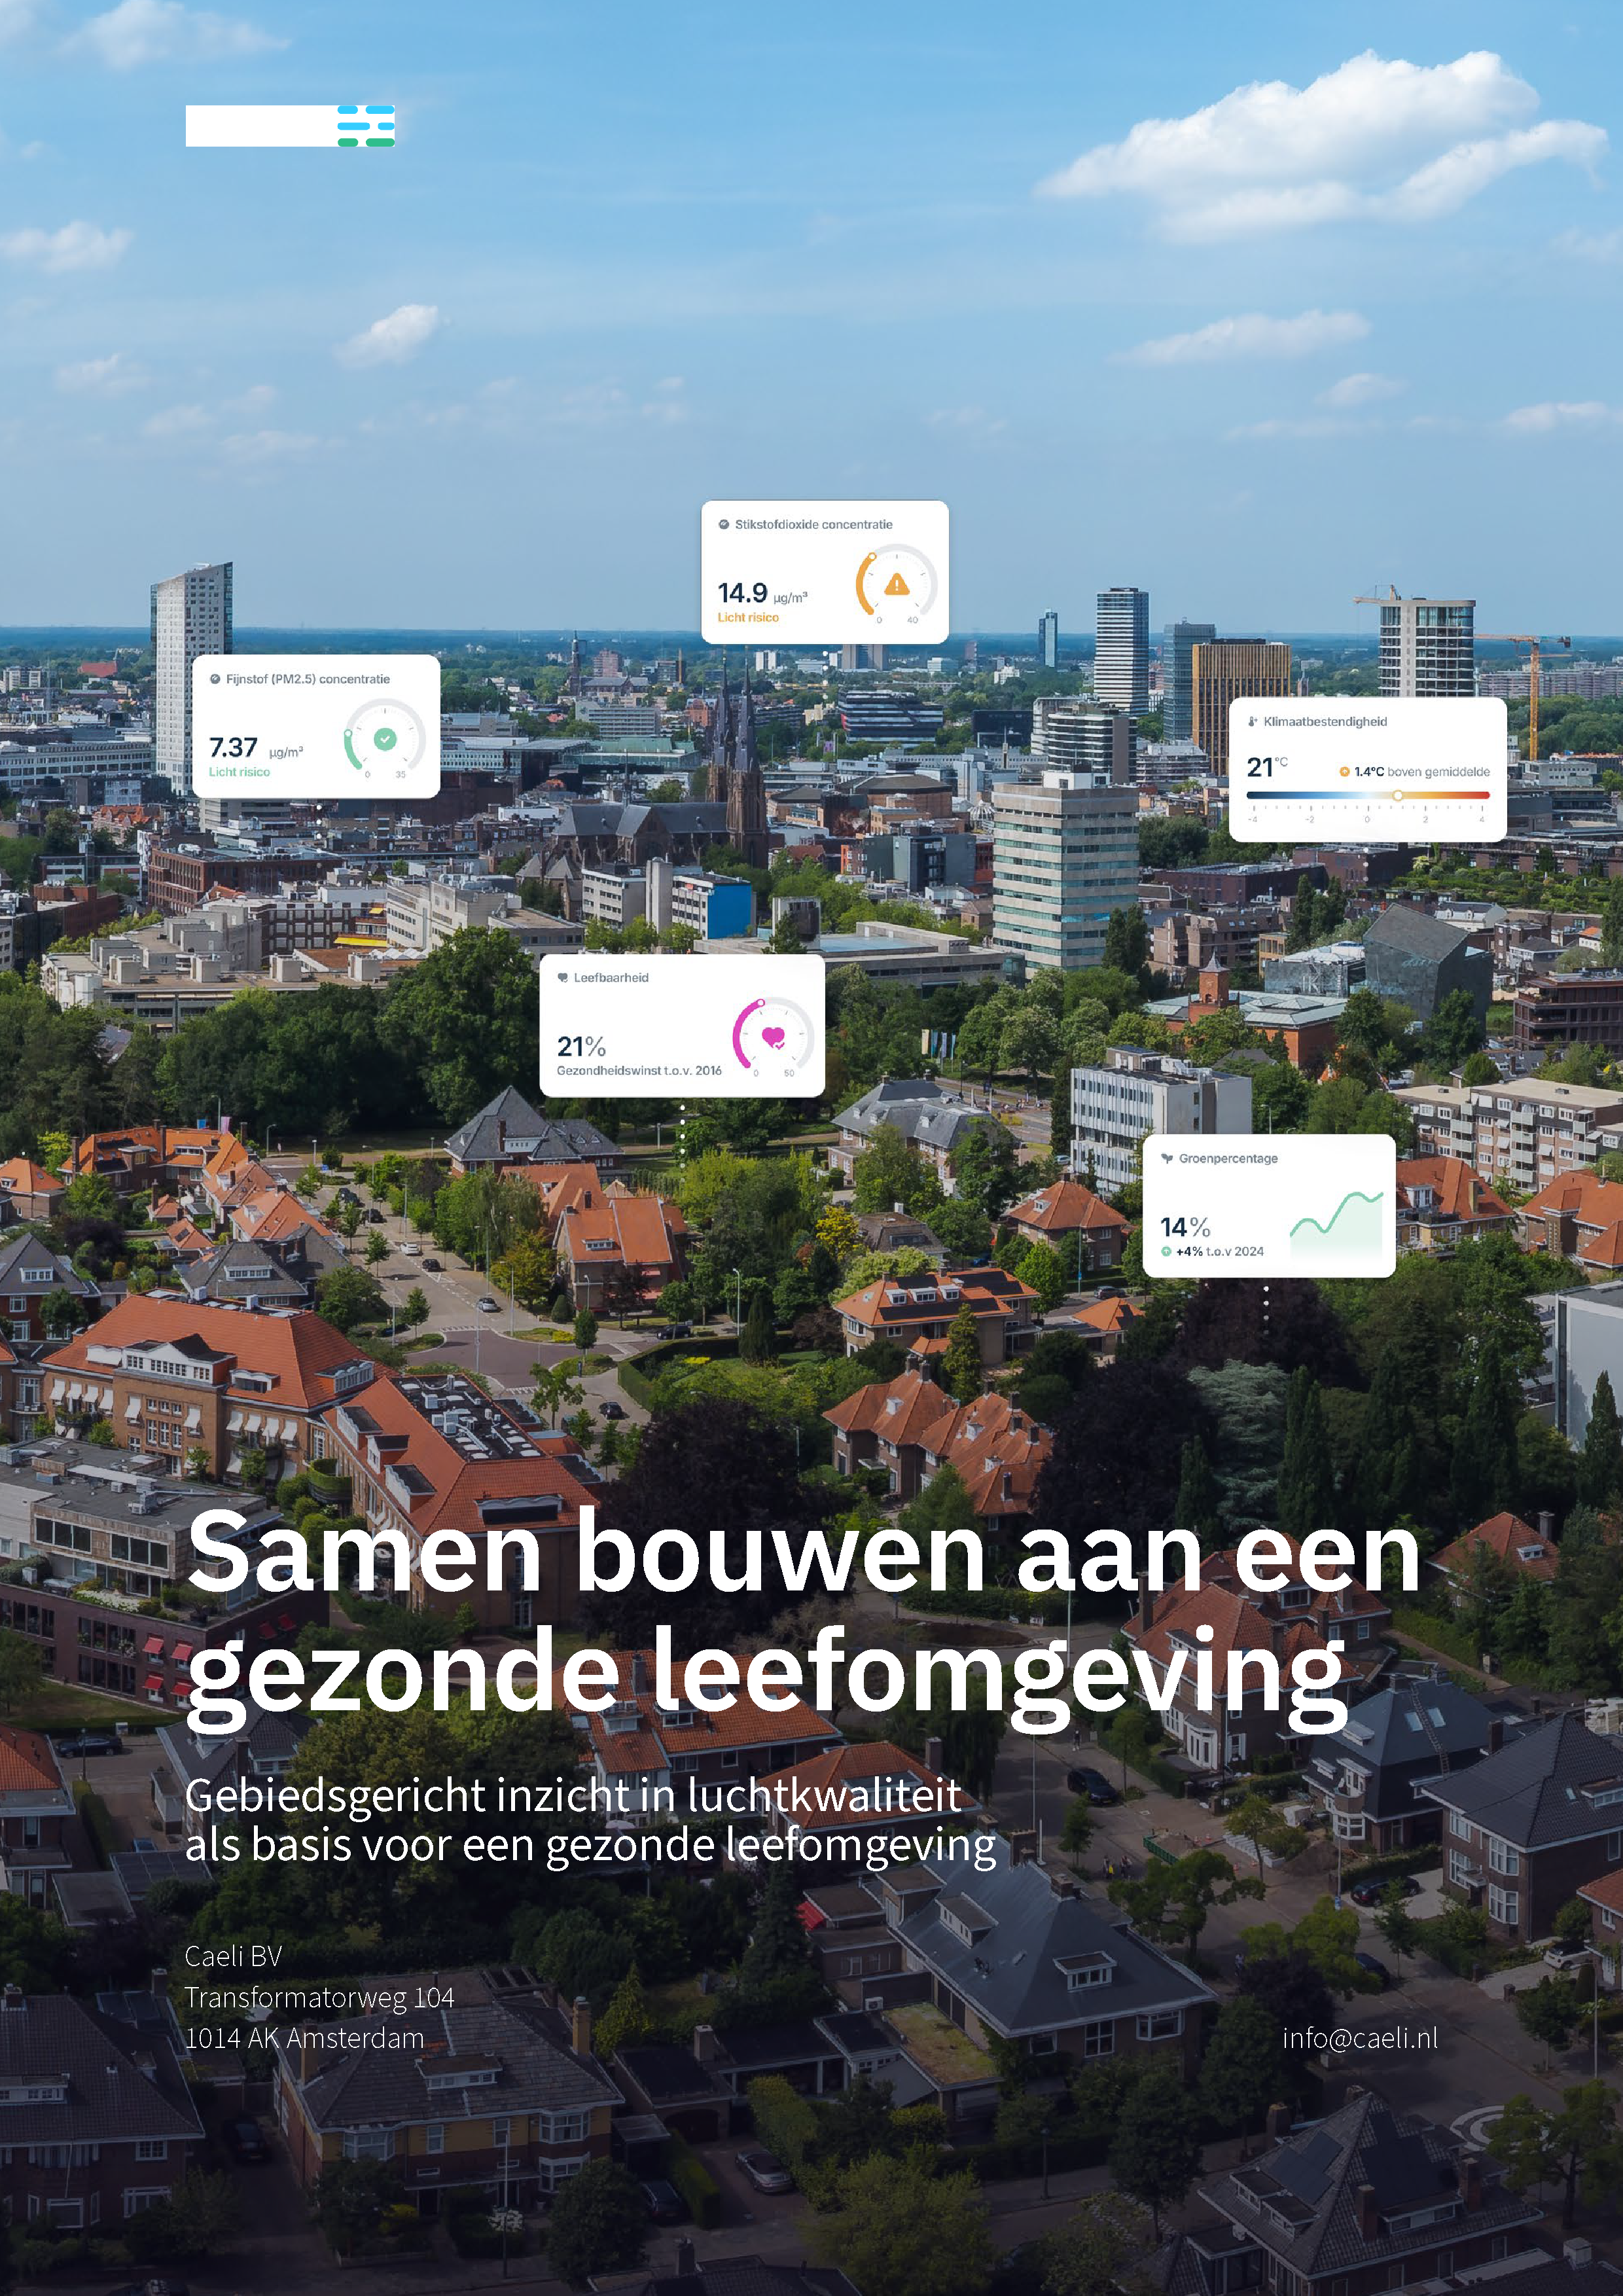
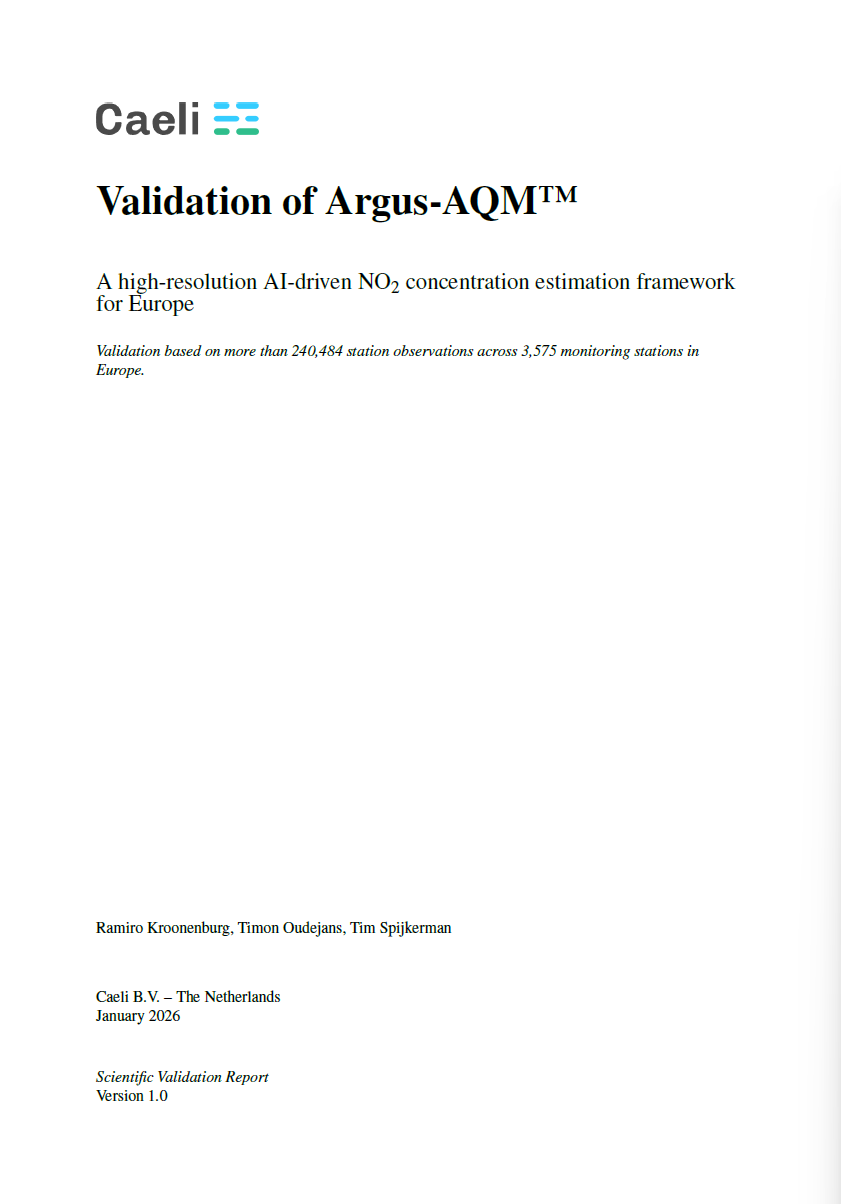
The brochure shows what AQM measures and what you can do with it. The validation report shows how reliable the data is.
Free PDF. Enter your email address and download right away.
Ready to start with the Air Quality Monitor?
Prefer to choose a package yourself? Go to the options above. Not sure yet? These questions can help.