Health
Insight into air quality for a healthier living environment
See air quality per neighbourhood and around sensitive sites. Use maps and time series in the conversation about prevention.
- See air quality per district and neighbourhood
- Follow exposure trends over time
- Bring a clear map into the conversation
Neighbourhood scan
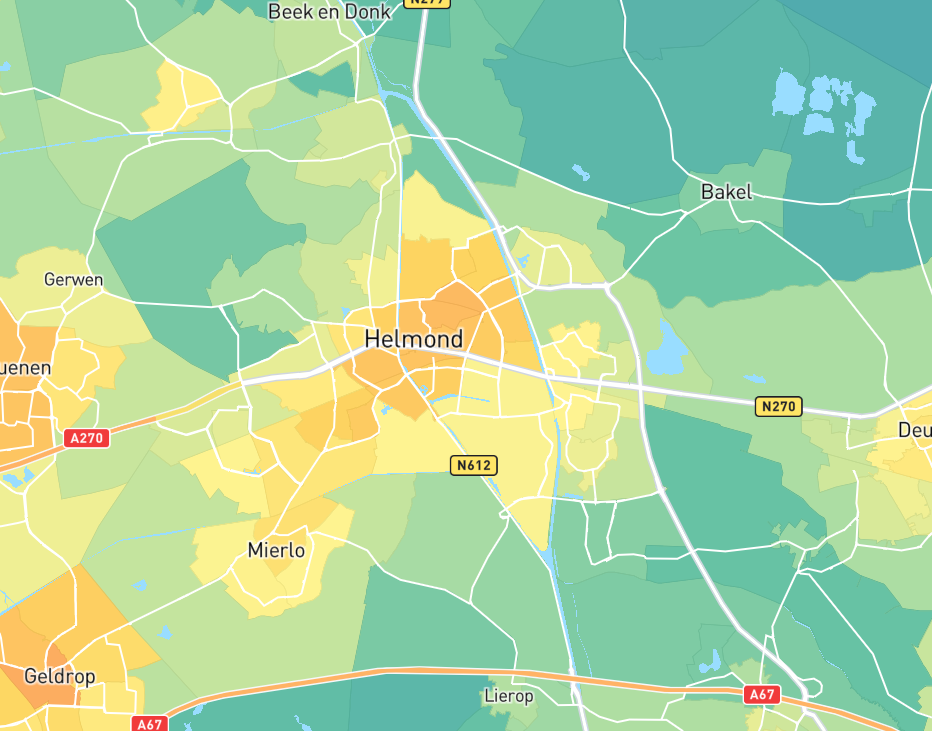
Air quality down to neighbourhood level
Not only a municipal average: neighbourhood-level insight into NO₂, particulate matter and composite indices. Use that to see exposure in your work area and talk with the municipality or care partners.
- See air quality per district and neighbourhood
- Follow exposure trends over time
- Bring a clear map into the conversation
Report
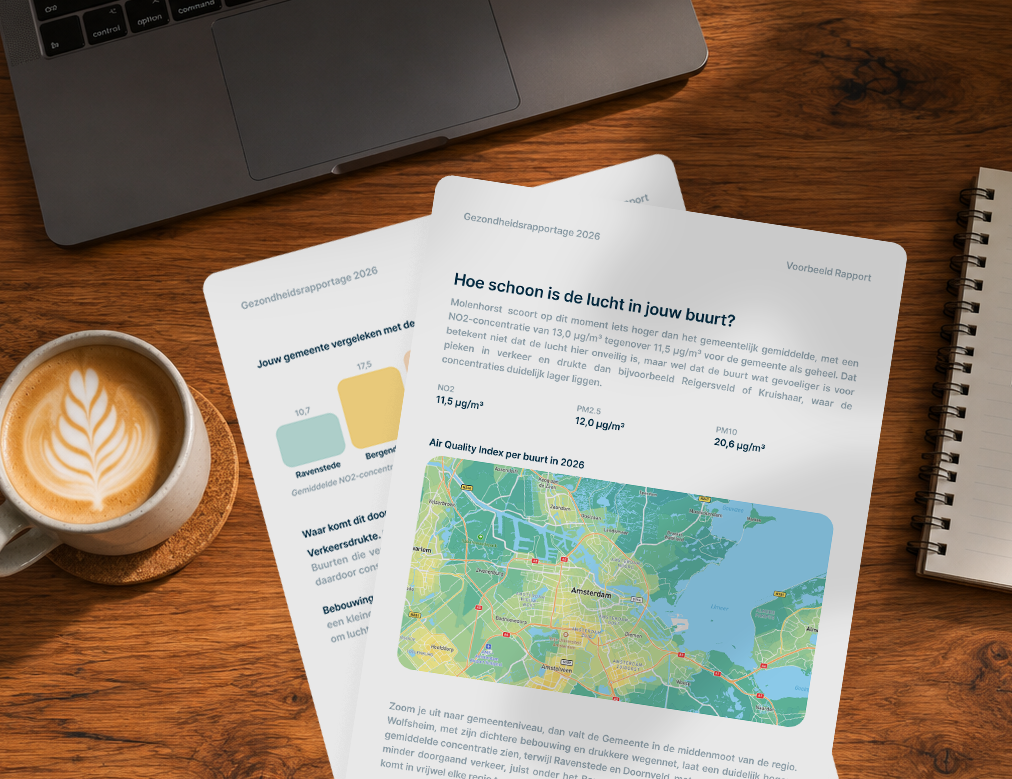
A report for your work area
Compile a report in plain language for the GGD, care or municipality. Compare neighbourhoods and share the overview with partners. The figures are area averages over time, not personal advice for outdoor activity.
- Compare neighbourhoods in the work area
- Explanation in plain language
- Ready to share with municipality and care partners
Health gains
Make health gains visible per municipality
Caeli translates air quality into calculated health gains per municipality, following the RIVM approach. Share reports on health gains with the GGD and municipality. That shows where prevention needs extra attention, and how you stand relative to the Clean Air Agreement.
- Calculated health gains per municipality following RIVM
- SLA target: 50% health gain in 2030 compared with 2016
- Progress at area level, not personal advice
Discuss air quality in your work area
For the GGD, care organisations and municipalities. Plan a conversation about maps and reports in your region.
Discuss air quality in your work area
For the GGD, care organisations and municipalities. Plan a conversation about maps and reports in your region.