

















ESA logoOfficial ESA Partner

Air quality mapped down to neighbourhood level

Caeli makes air quality and emissions across the Netherlands visible at high resolution, to help build a cleaner living environment.

  • Insight down to neighbourhood level
  • Data available from 2019
  • Validated with ground measurements

Clients and partnerships in the Netherlands

Esri
VU
ESA
NSO
Hilversum
Helmond
Kampen
Deventer
Zeeland
Sittard-Geleen
Almere
UBS
KPMG
Spacened
RVO
DMI

Products

Find the right product for your environmental and climate challenges

To help you tackle air pollution and climate-related problems, we offer several products that deliver clear insights.

Air Quality Monitor

Air quality down to neighbourhood level

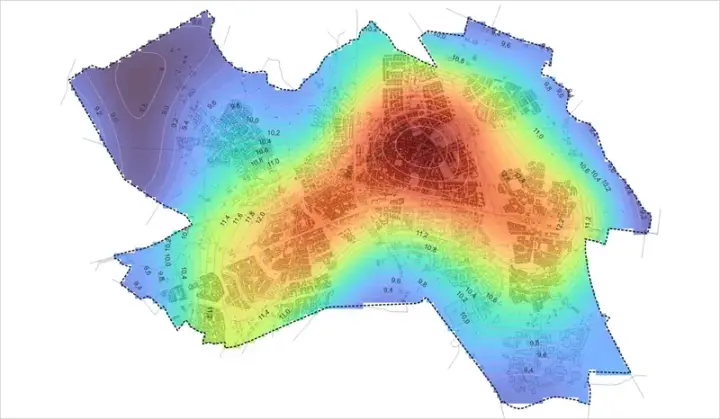
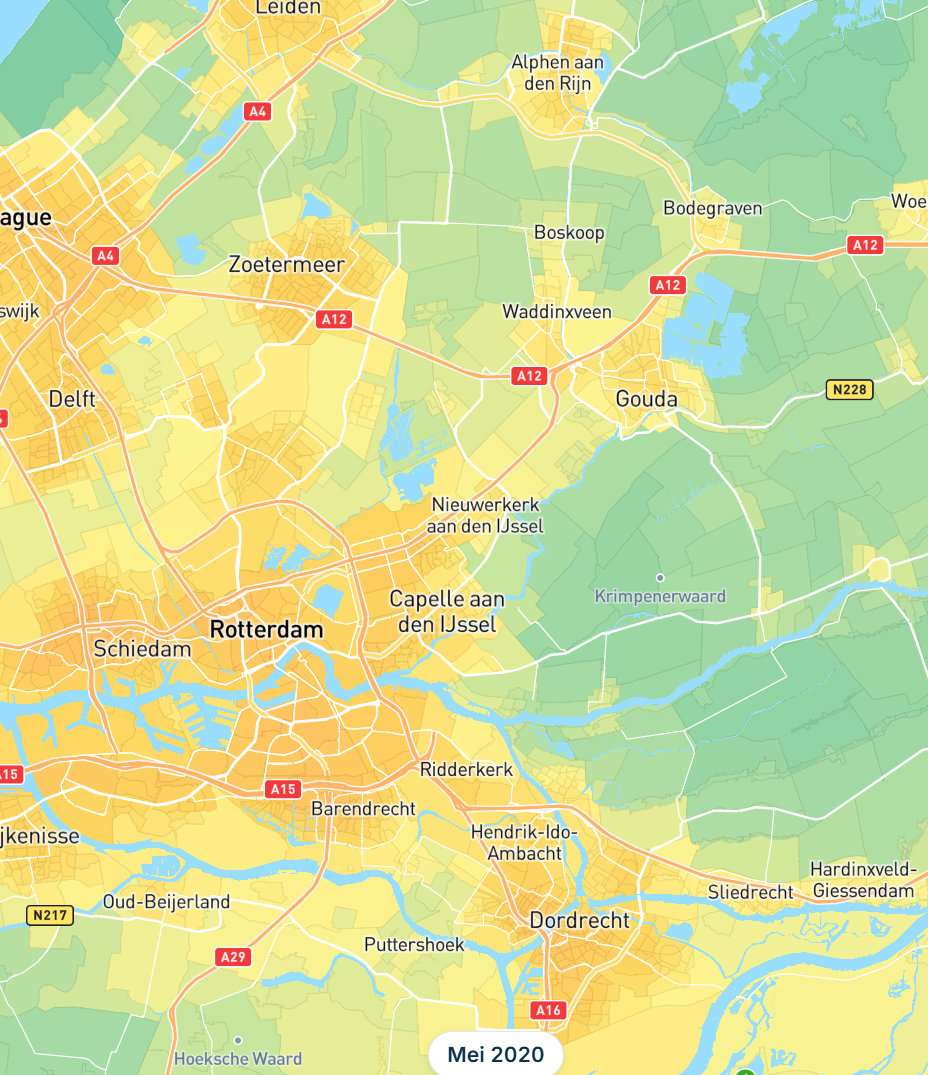
See how air quality changes per neighbourhood and back choices for a healthier living environment. Ground stations do not cover every neighbourhood. AQM fills that gap with satellite observations validated against ground measurements, so you see NO₂, particulate matter and other indicators across the whole area. Down to neighbourhood level, available as maps and time series in the dashboard and via the API.

View Air Quality Monitor
  • Historical data since 2019
  • National coverage without your own monitoring network
  • Ready to use via dashboard and API
  • Gemeente Hilversum
  • Gemeente Deventer
  • Provincie Zeeland
  • Gemeente Helmond
  • Gemeente Sittard
  • Gemeente Almere

Already used by governments in the Netherlands

Map with air quality per area and hotspots at neighbourhood scale

Carbon Eye

Verify CO₂ claims per location with satellite data

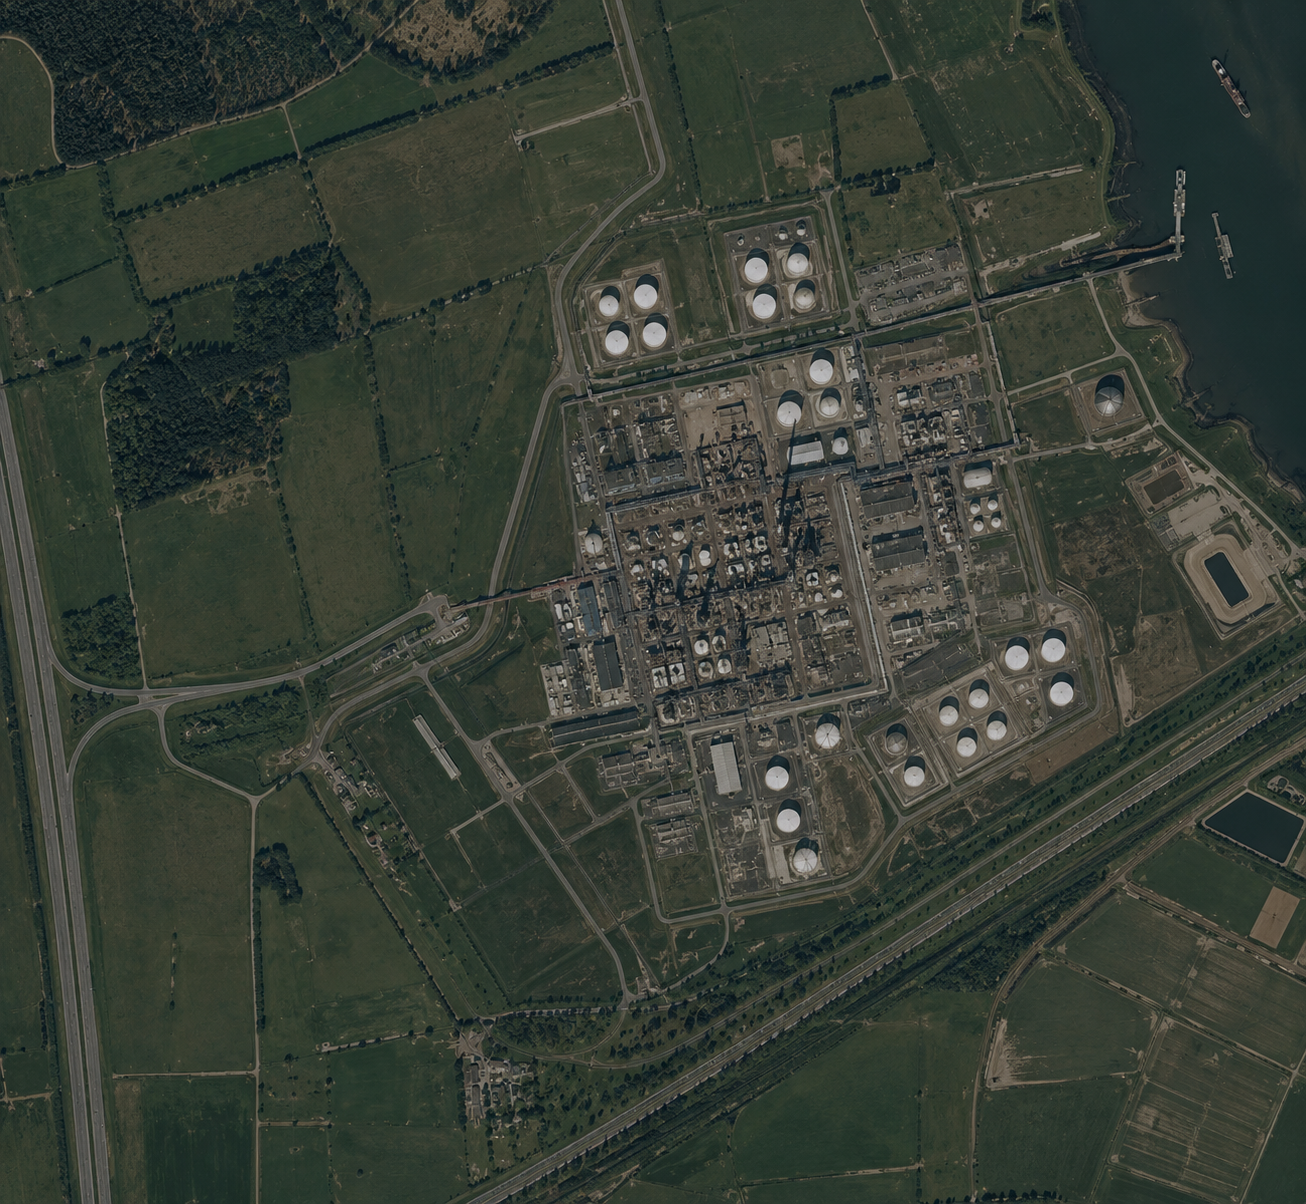
See per location whether reported CO₂ emissions match what satellites measure. Emission inventories and internal estimates are often incomplete or delayed. Carbon Eye compares reported CO₂ with satellite observations so you can see where claim and measurement diverge per asset or location, including outside local monitoring networks.

Discover Carbon Eye
  • Check reported emissions against the satellite signal
  • Fact-check per asset or portfolio
  • Multi-year trends, not a snapshot
ESA

Powered by ESA

Satellite image for portfolio screening of emission signals

Nitrogen module

Insight into ammonia concentrations around your area

Track how ammonia develops around your area and back measures with measurements. Measurements in the area show how the ammonia concentration develops, set against the background. A learning model combines those measurements with satellite data. Deposition in the area itself remains an estimate from that model, checked against measured concentrations.

View Nitrogen module
  • Measurements in the area
  • Register measures
  • Trend against the background
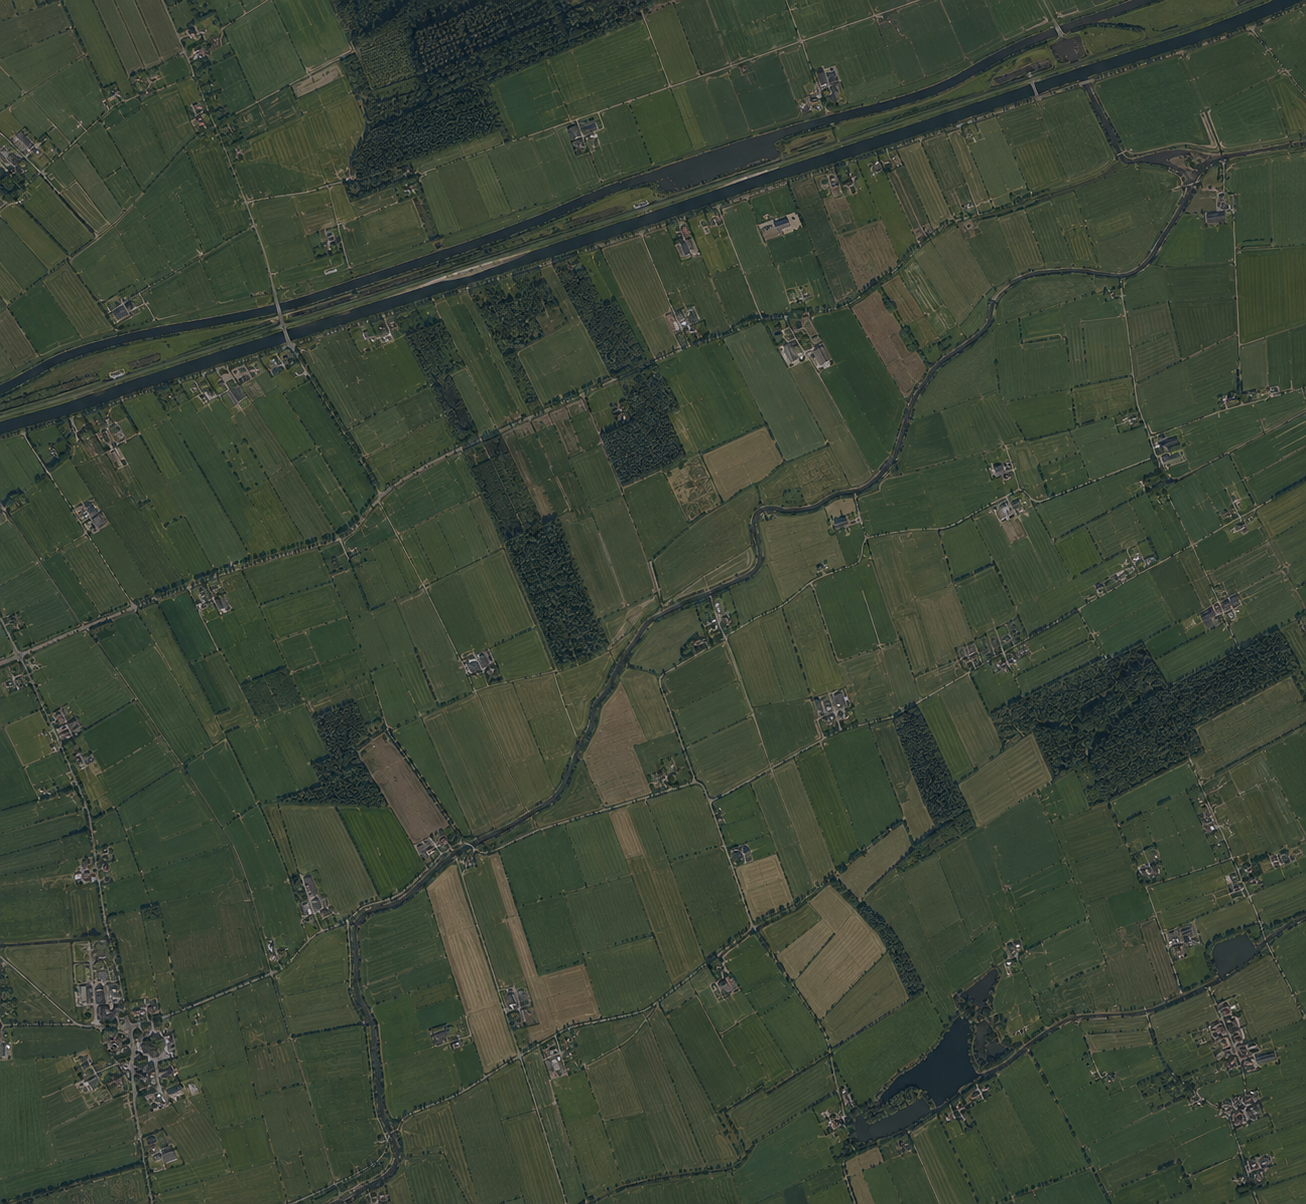
Satellite image of agricultural fields as background for ammonia monitoring

Approach

From satellite signal to reliable insight

Outside the monitoring network you often miss the places that matter. Caeli makes air quality and emissions visible with satellite data, AI and ground-station validation.

  • Satellite observation to neighbourhood level

    From satellite to district and neighbourhood, sharpened with AI and land use. Also outside the monitoring network.

  • Validation on 5,000+ stations

    Checked against more than 5,000 reference stations across Europe, so maps and time series stay traceable for policy and reporting.

  • Clear in the dashboard and products

    In our dashboard and products we bring several pollutants together, so you have insight into air quality everywhere.

Compare with:

Capability
Caeli AQM
RIVM GCN
Monthly updates
Yes
Yearly
Ammonia available
Yes
Yes
Neighbourhood-level resolution
Yes
Grid level
Traceable calculation method
Yes
Limited
Validation against official stations
Yes
Yes
Regional customisation
Yes
No
Usable for policy and enforcement
Yes
Yes

Frequently asked questions about measuring air quality

More questions? Visit our FAQ page

Take the first steps toward a cleaner living environment