Consultancies and engineering firms
From air quality data to well-founded advice
Maps and trends at neighbourhood level for your advice. Share the same picture with your client.
- Hotspots per district and neighbourhood
- Distance to the 2030 limit values
- The same method for every analysis
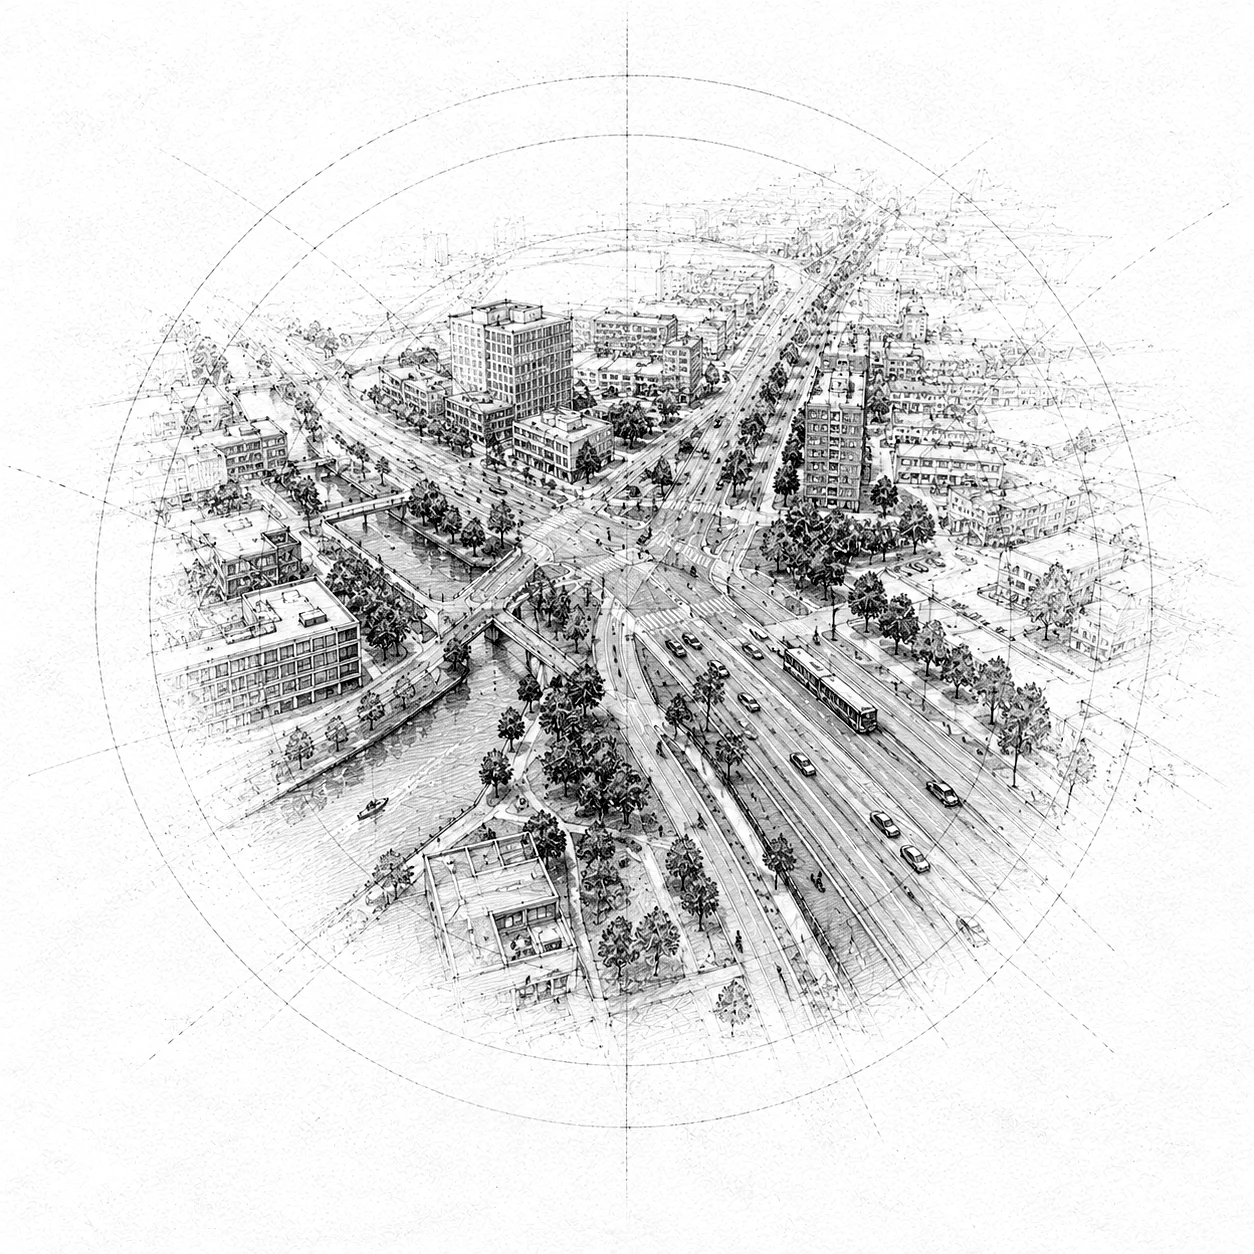
Scoping
See early in the project where air quality will matter
Scan the plan area and surroundings for hotspots outside the monitoring network. That helps you judge earlier whether detailed research is needed, and where the gap to the 2030 limit values is smallest. Your own analysis and modelling stay leading. The data supplies the starting point.
- Hotspots per district and neighbourhood
- Distance to the 2030 limit values
- The same method for every analysis
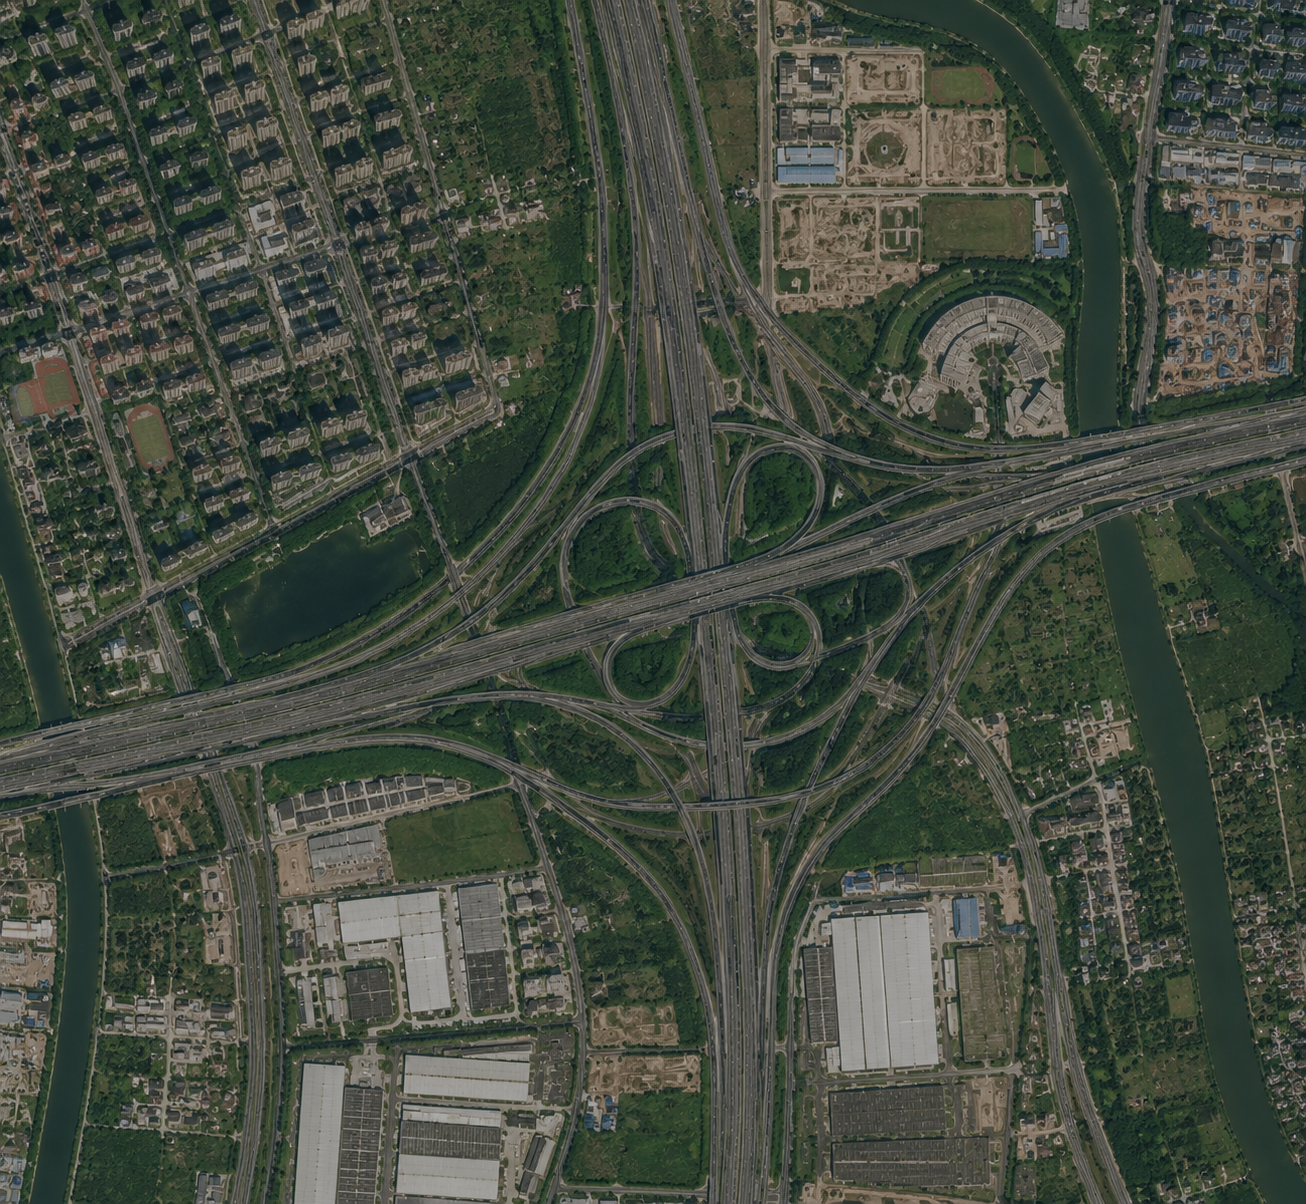
2030 roadmap
Back the roadmap with trends from 2019
Where exceedance looks likely, municipalities must deliver a roadmap by the end of 2028. Show the current situation and how each district develops, and check the path toward 20 µg/m³. The same series shows whether a measure works. Fit as evidence next to your advice, not as a statutory assessment.
- Multi-year trends per district from 2019
- Comparison with the 2030 limit values
- Measure effects in one time series
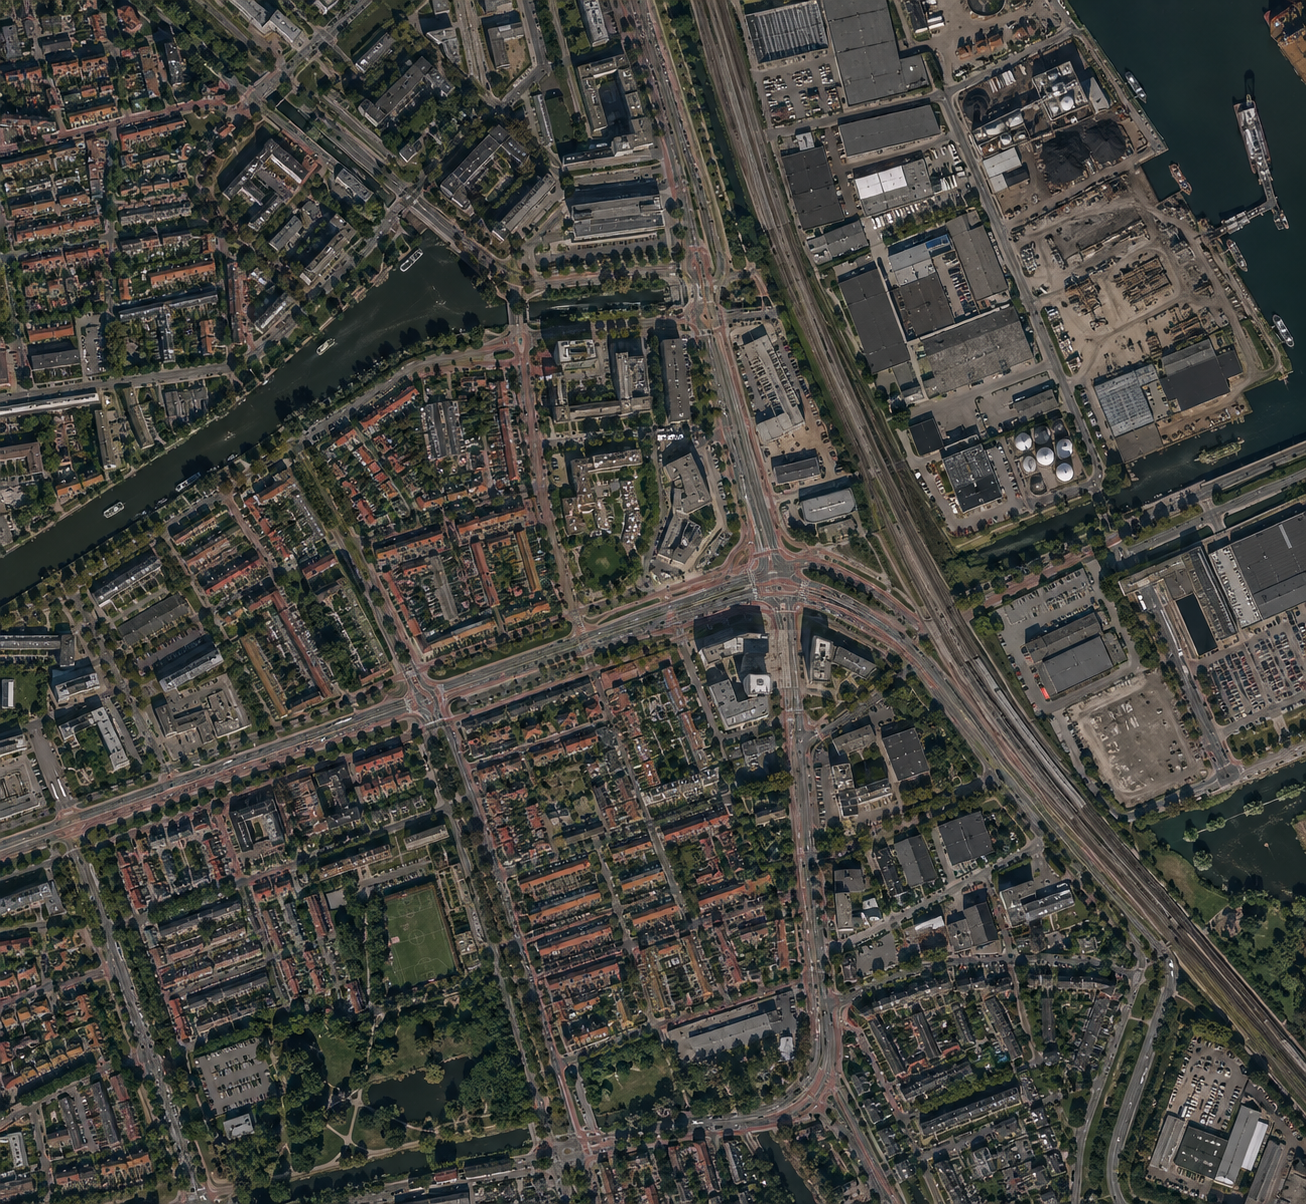
Reporting
Maps and time series in your report and GIS
Put maps and time series in your report, or link them via WMS, WMTS and WFS in QGIS or ArcGIS. PNG and SVG exports fit report annexes. The method stays traceable, so client and supervisor can follow the result. Which exports, connections and usage rights fit is something we settle per assignment.
- WMS, WMTS and WFS in your GIS
- Exports for report annexes
- Method traceable to satellite and validation
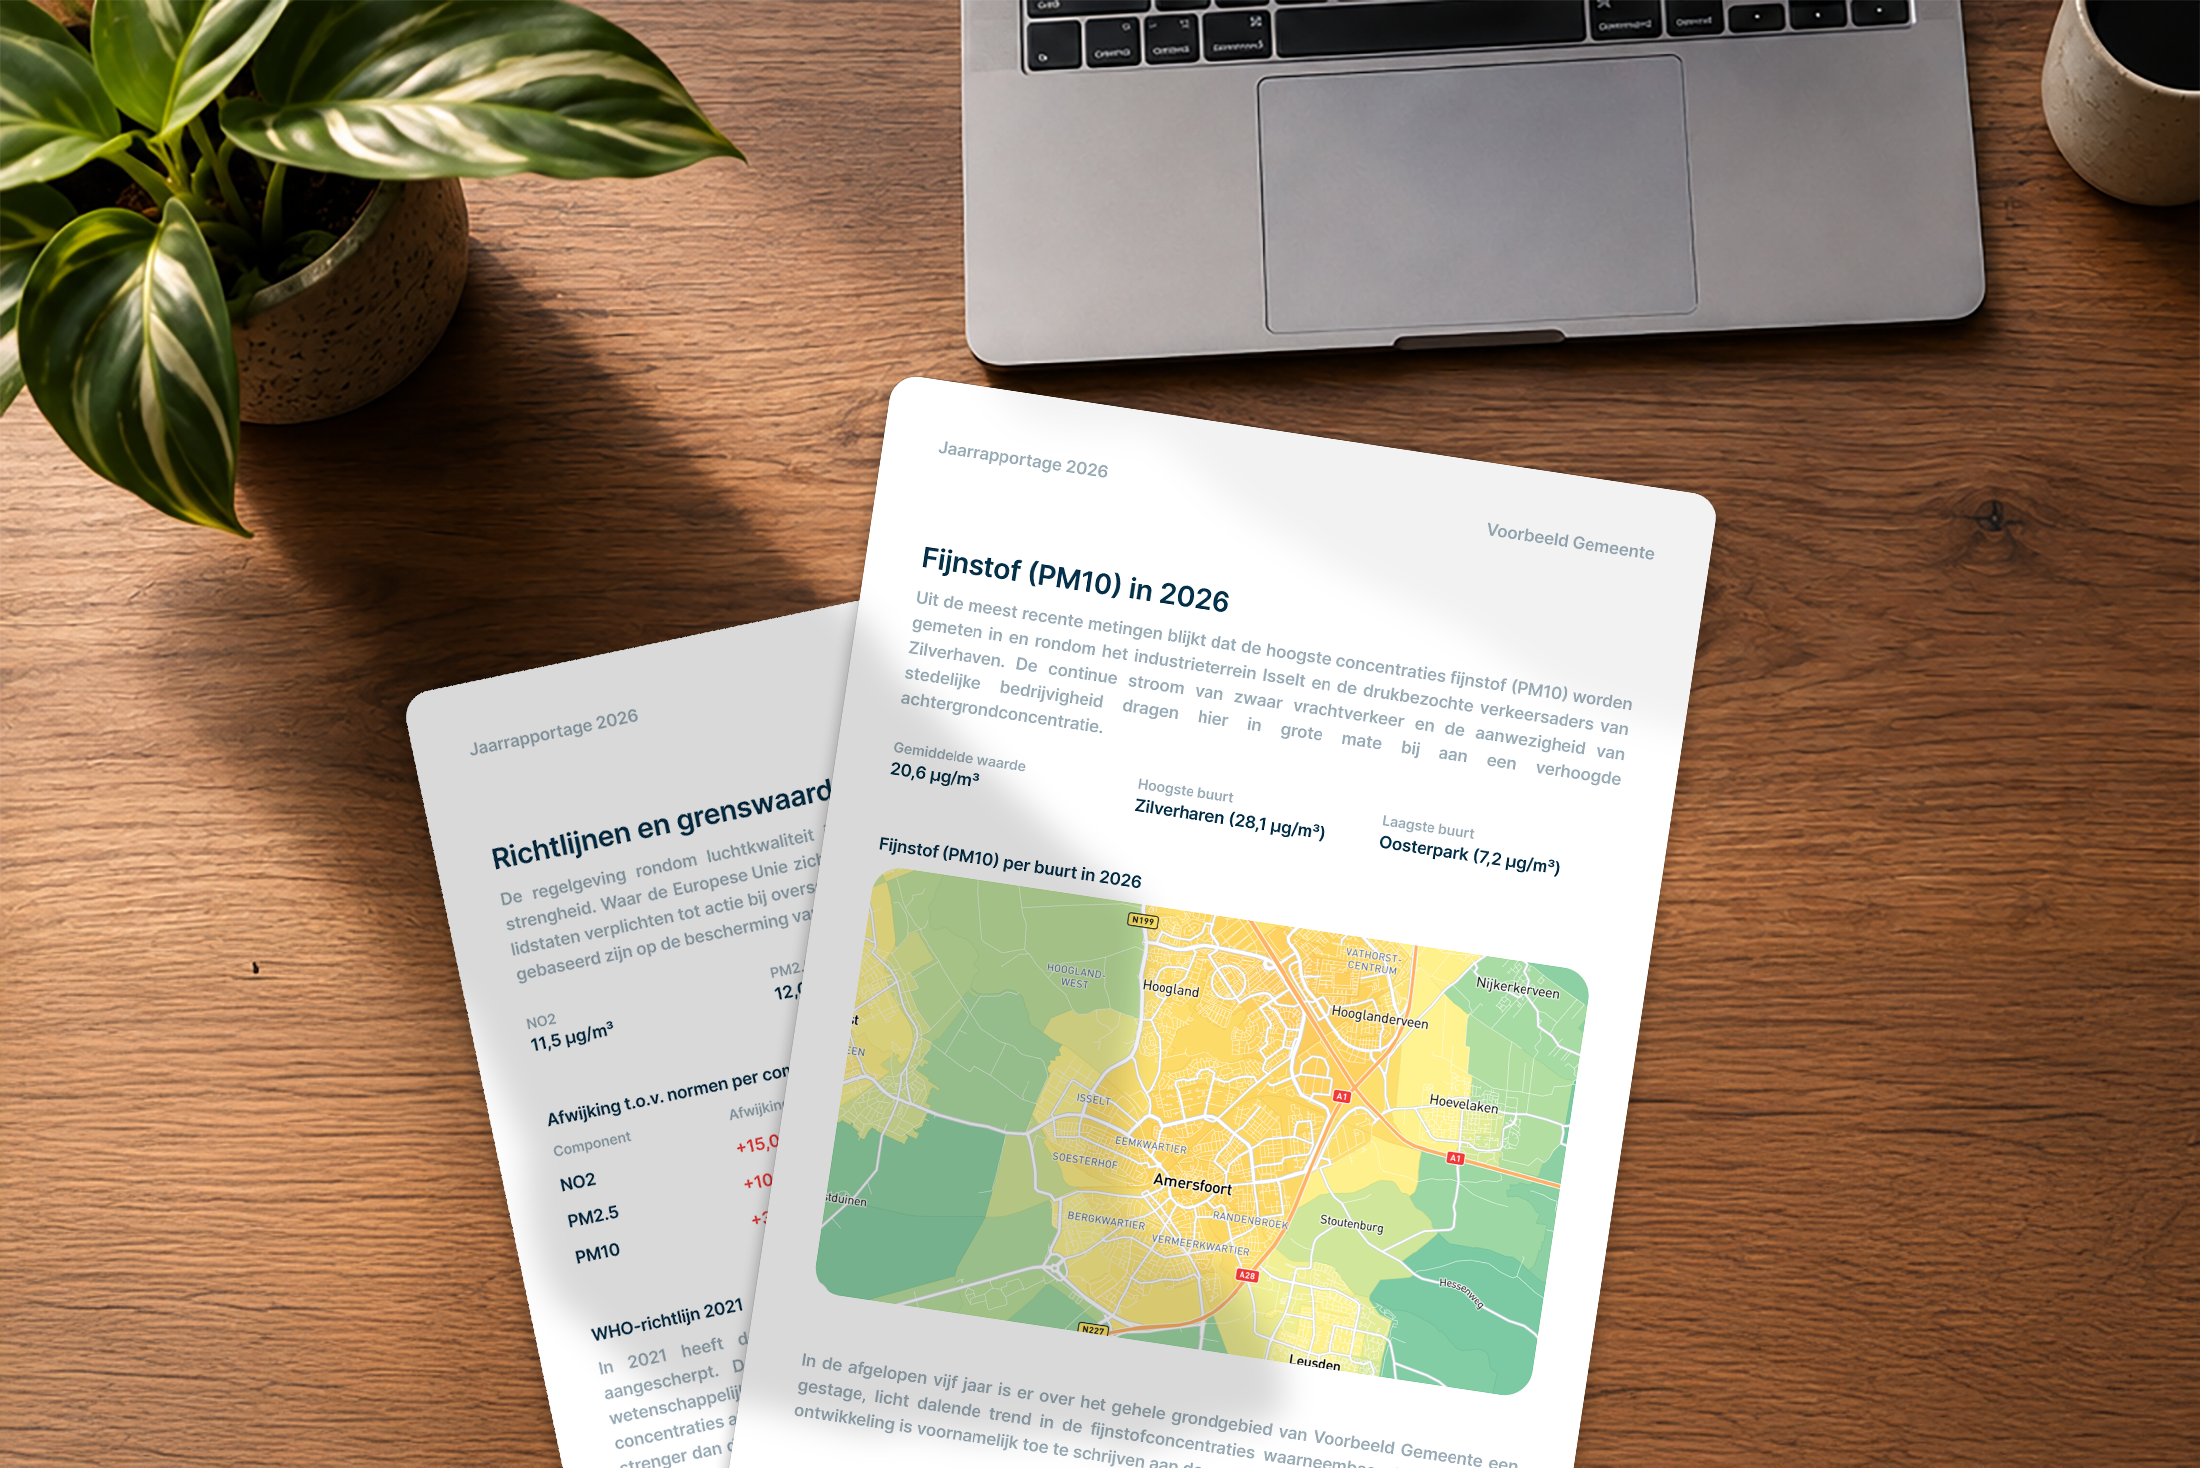
Package
Air Quality Monitor for your firm
Work from the same source as your client. We tailor dashboard, exports and usage rights to your projects.
- Maps and trends for advice and reports
- Same method as for municipalities
- Exports and GIS link by agreement
Frequently asked questions from consultancies and engineering firms
Talk through the data for your next project
Book a conversation about your air quality question. Together we look at which data supports your analysis and advice.