Municipalities
Faster insight into air quality. More time for policy.
Collecting and comparing data takes time. Caeli brings it together in maps and reports for your policy work.
- Save time in preparation
- Direct your budget more precisely
- Share understandable insight with administrators and partners
Already used by municipalities in the Netherlands




Health gains
Make health gains visible per municipality
Caeli translates air quality into calculated health gains per municipality, following the RIVM approach. Share reports on health gains with the GGD and municipality. That shows where prevention needs extra attention, and how you stand relative to the Clean Air Agreement.
- Calculated health gains per municipality following RIVM
- SLA target: 50% health gain in 2030 compared with 2016
- Progress at area level, not personal advice
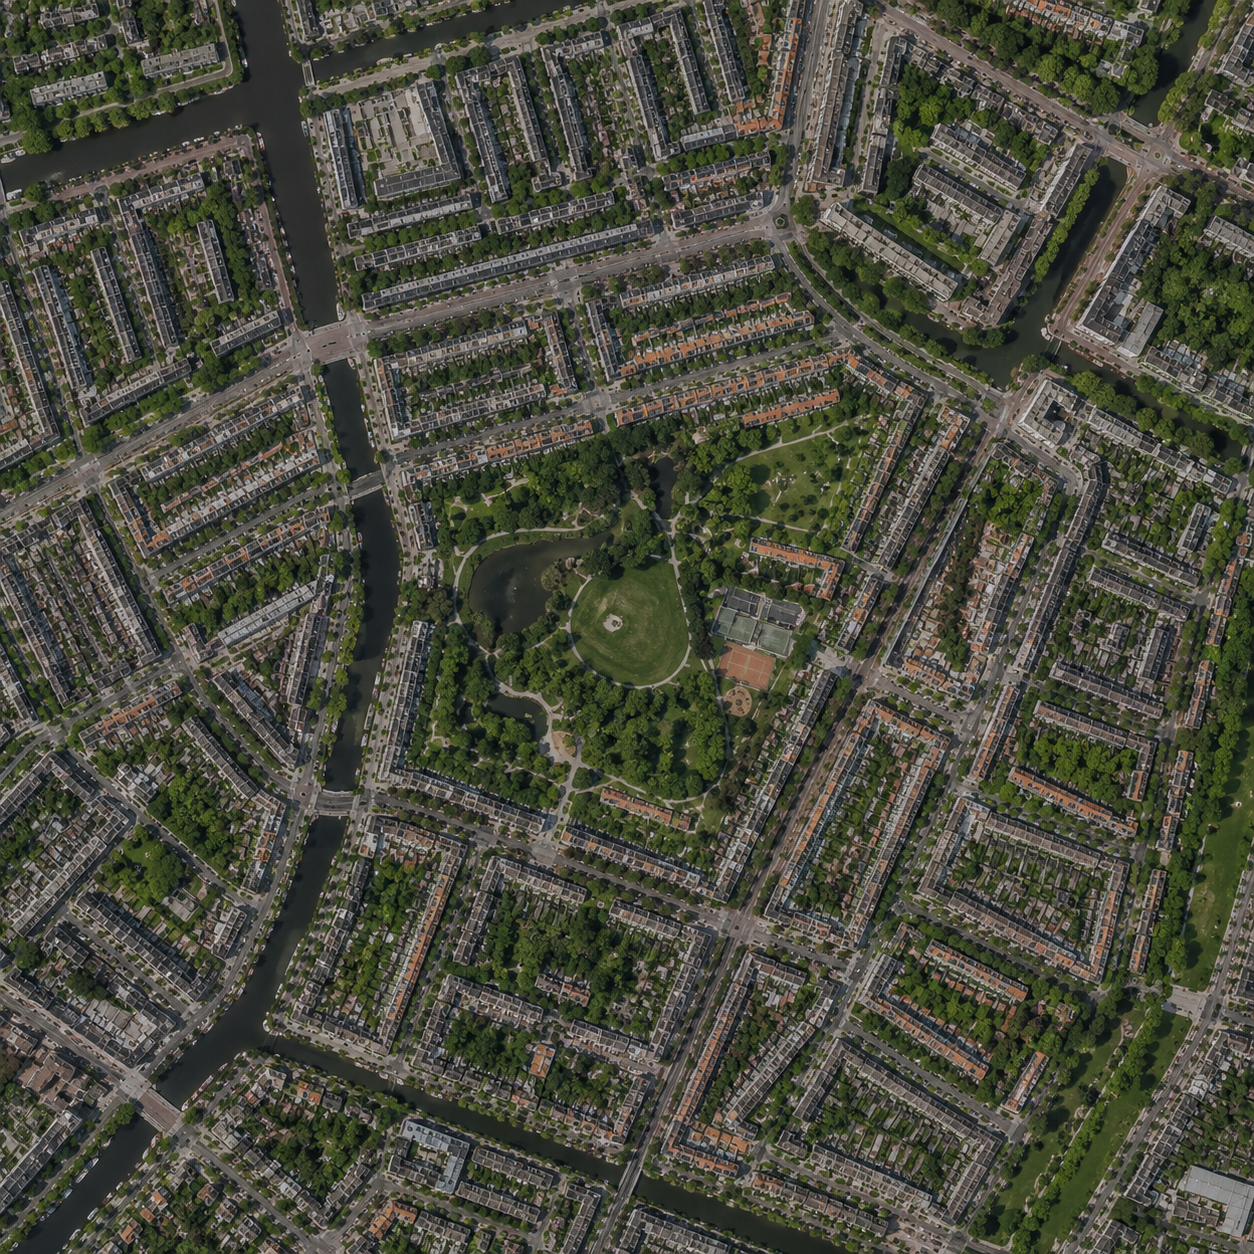
Overview
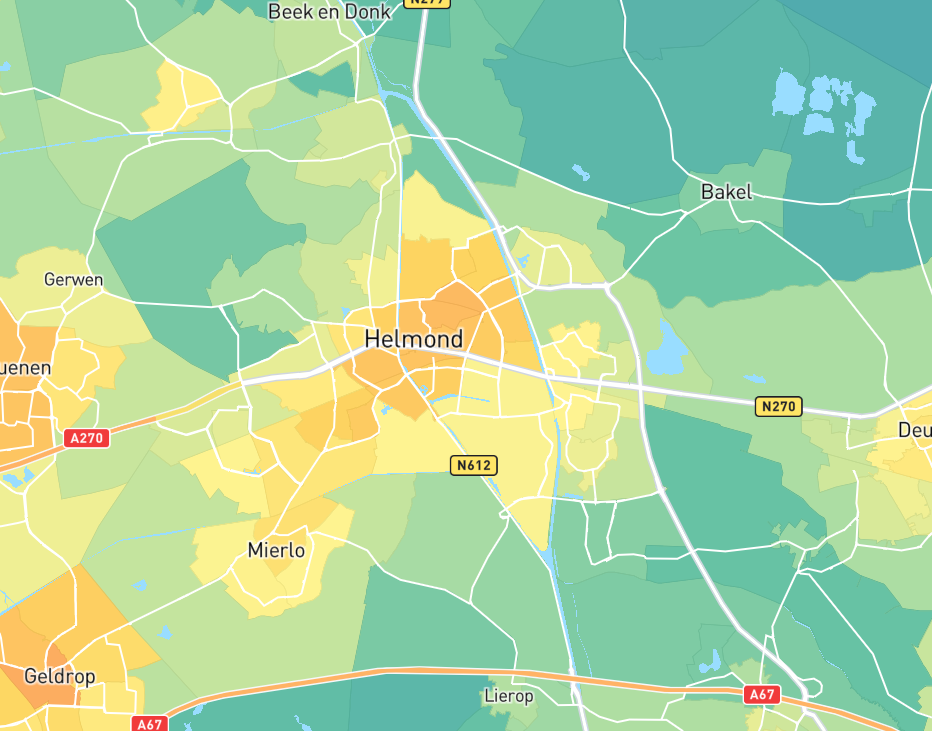
Less searching, more overview
With the Air Quality Monitor you see how air quality develops per neighbourhood, including outside the monitoring network. Use those maps and figures in your policy documents and meetings, without gathering them yourself first.
- Save time in preparation
- Direct your budget more precisely
- Share understandable insight with administrators and partners
Risks
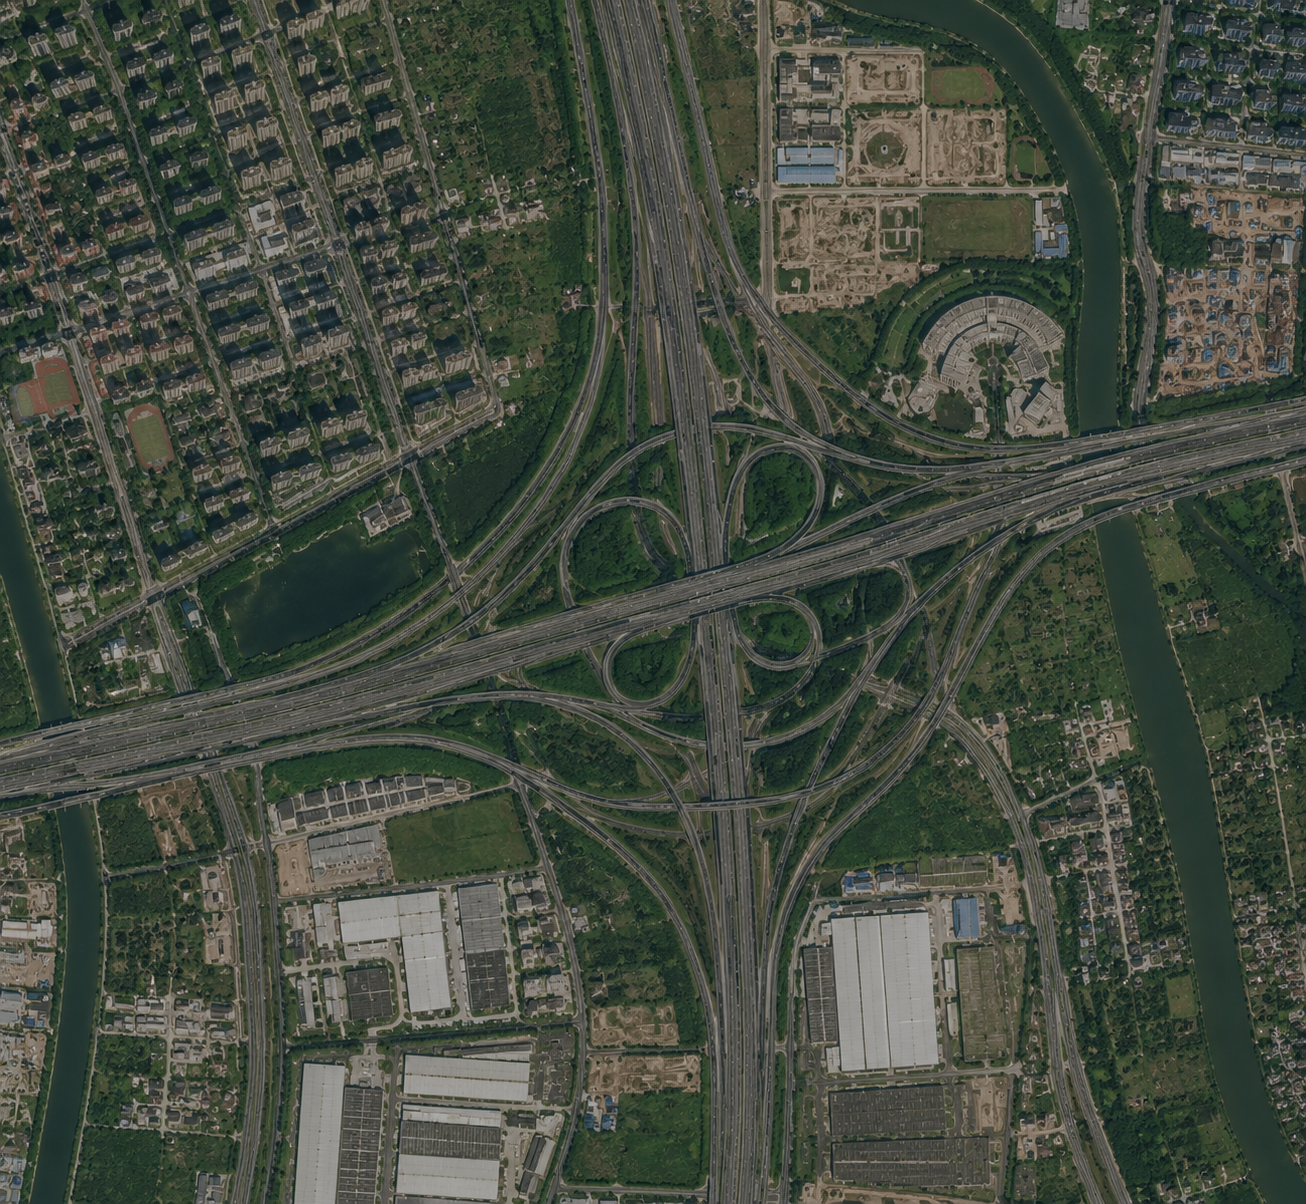
See which neighbourhoods and sites need attention
Link air quality to sensitive locations such as care, housing, education and gathering. That shows where pressure is highest and where further study is worthwhile.
- Four types of vulnerable sites in one overview
- See where sites sit above the standard
- Decide where further study is worthwhile
Support
Support for your day-to-day work
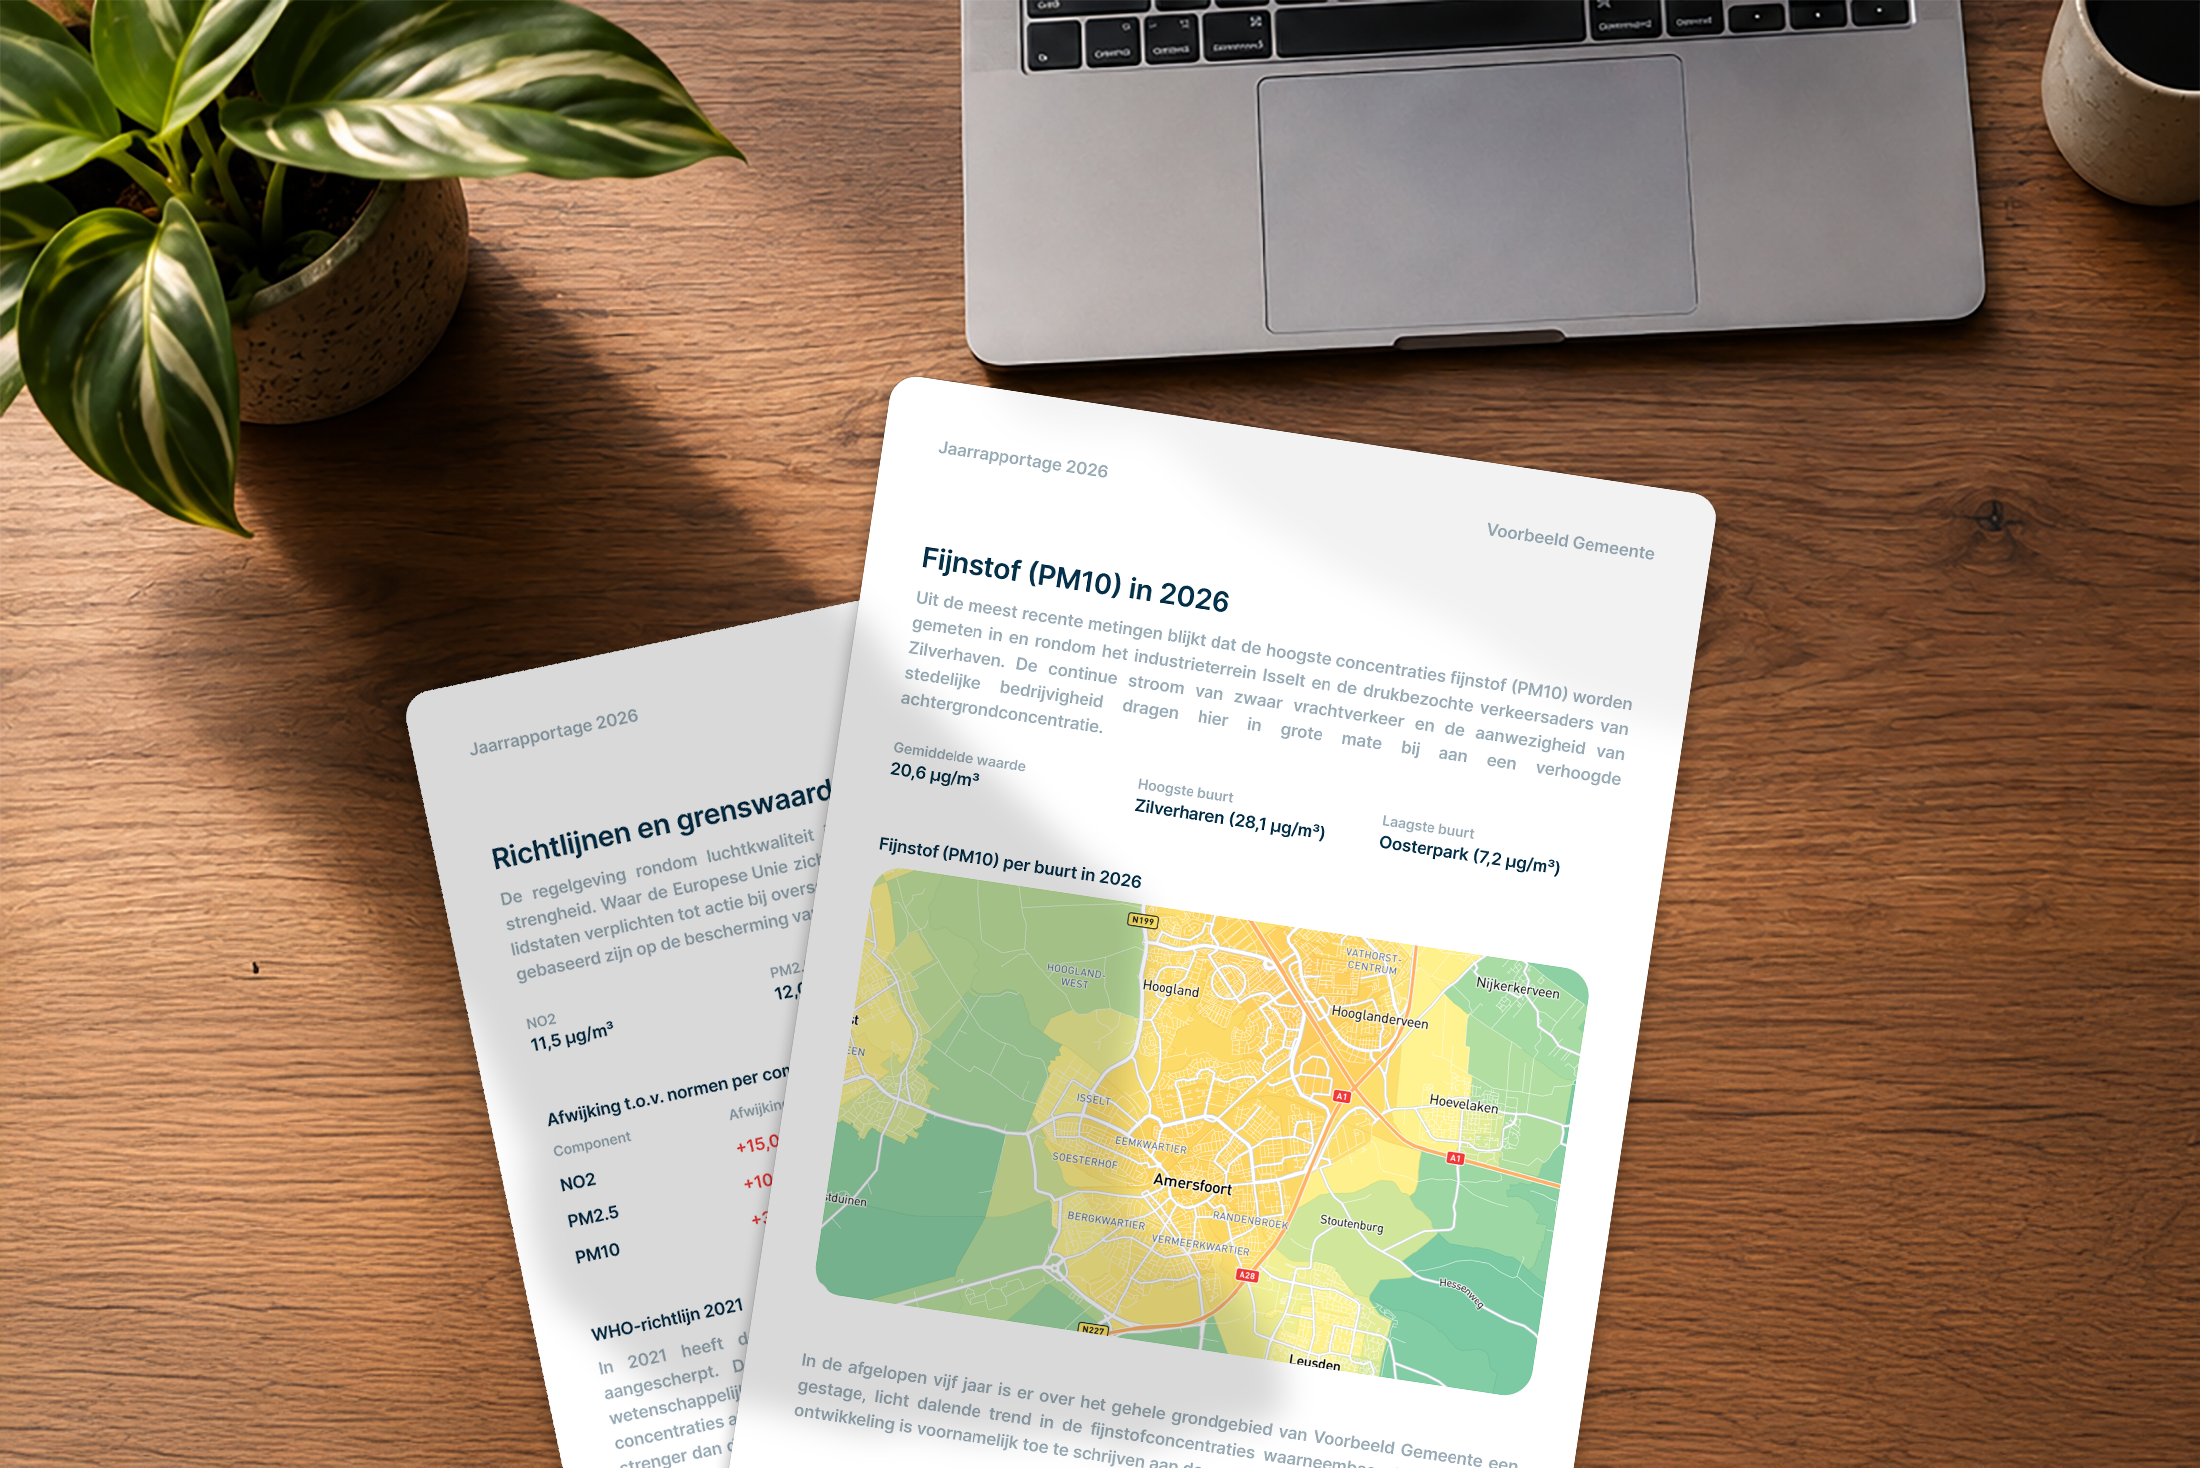
You know your municipality and the questions that come up. Caeli supplies the data and the overview to underpin choices, from the annual report to a map for the council. That leaves you more time for coordination, advice and delivery.
- Annual reports on compliance and progress
- Maps and figures for administrators and partners
- More time for coordination and delivery
Solutions
Put the Air Quality Monitor to work in your municipality
A fixed package for Dutch municipalities up to 50,000 inhabitants. Above that, a tailored proposal.
These municipalities already use Caeli
Ready to start with the Air Quality Monitor?
Prefer to pick a package yourself? Use the options above. If you are not sure yet, these questions will help.