Farmers
Follow ammonia concentrations around your area
See how concentrations develop in the region. Share that overview with the collective and adviser, and discuss which next steps fit the area.
- One overview of the area
- A shared conversation about the figures
- Targeted next steps with your adviser
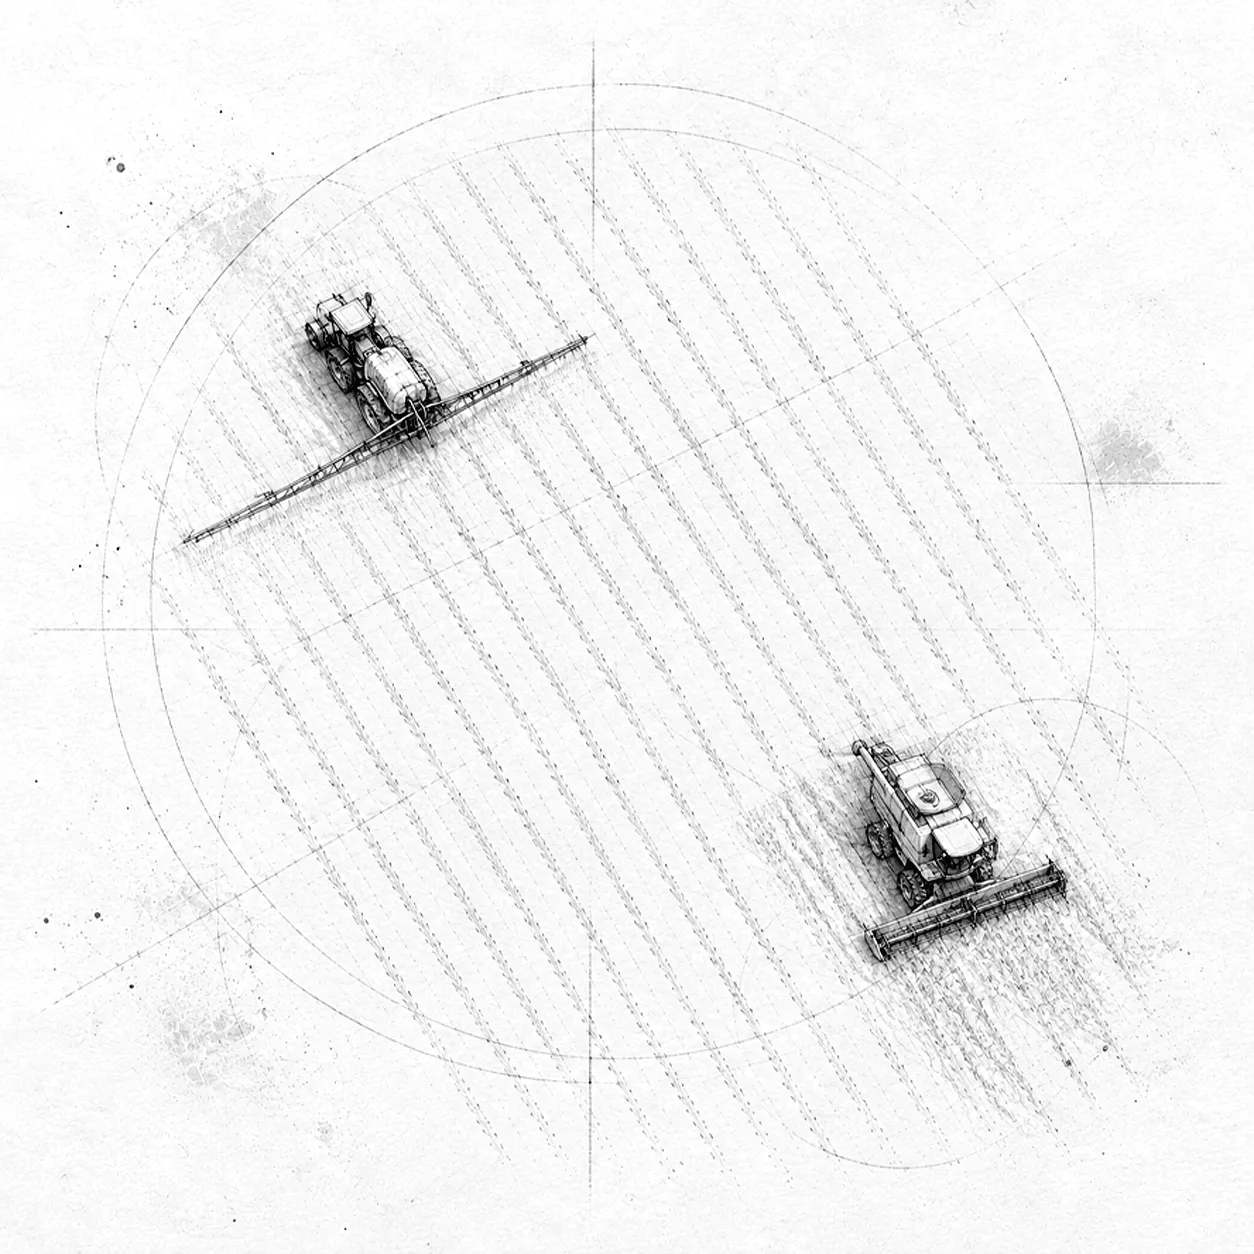
Ammonia trend
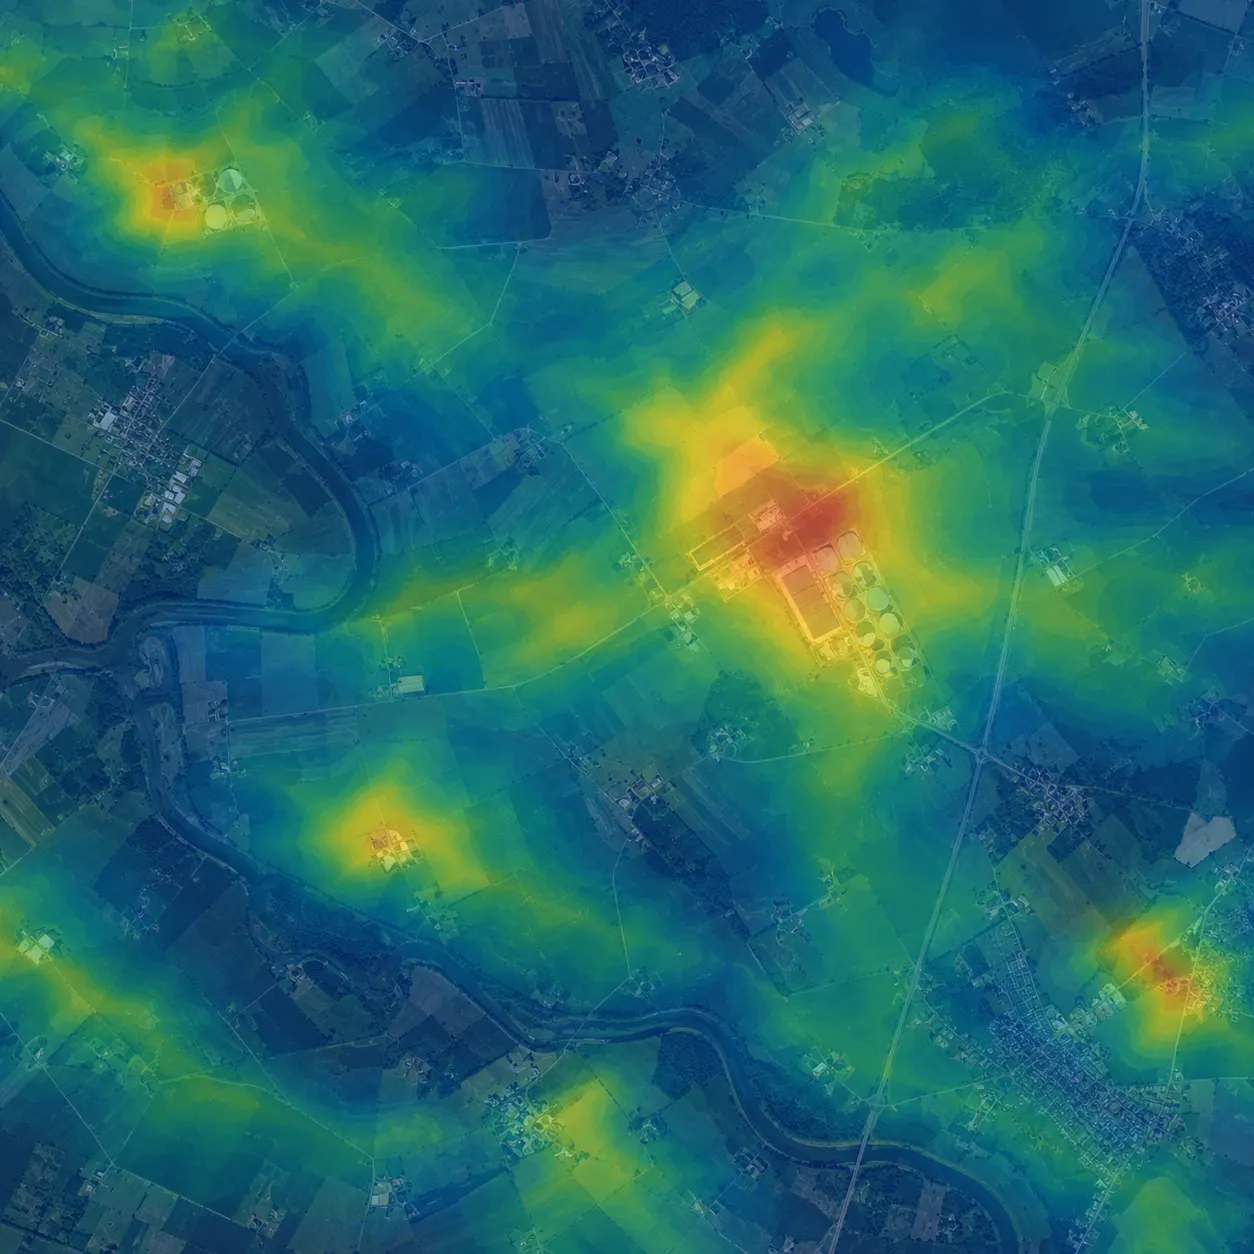
NH₃
Area monitoring
Map ammonia across a farming area
Work with a collective or area partner to map how ammonia concentrations develop across the area and over time. That creates a shared starting point for measures and discussion.
- One traceable picture for the collective and partners
- Area coverage including outside the monitoring network
- Start the conversation from the same facts
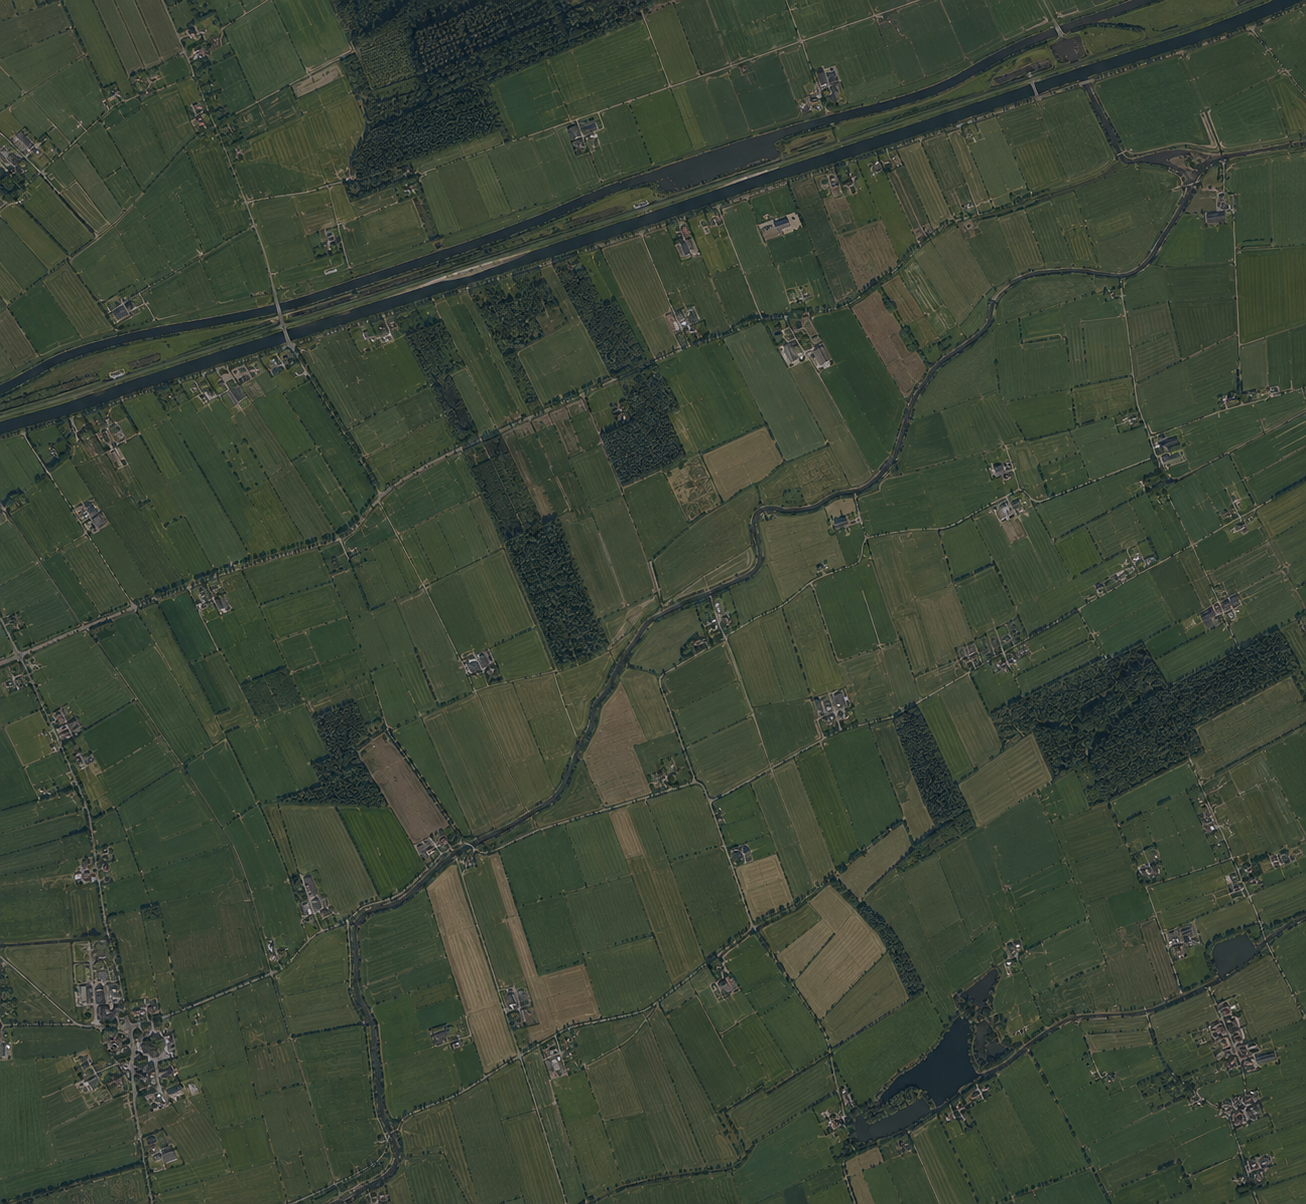
Development
Follow developments after your measures
See how ammonia concentrations develop and discuss with your adviser which factors may play a role. The effect per measure remains an estimate. The figures are not proof in a permit.
- Follow concentrations over time
- Compare years and seasons
- Discuss next steps with your adviser
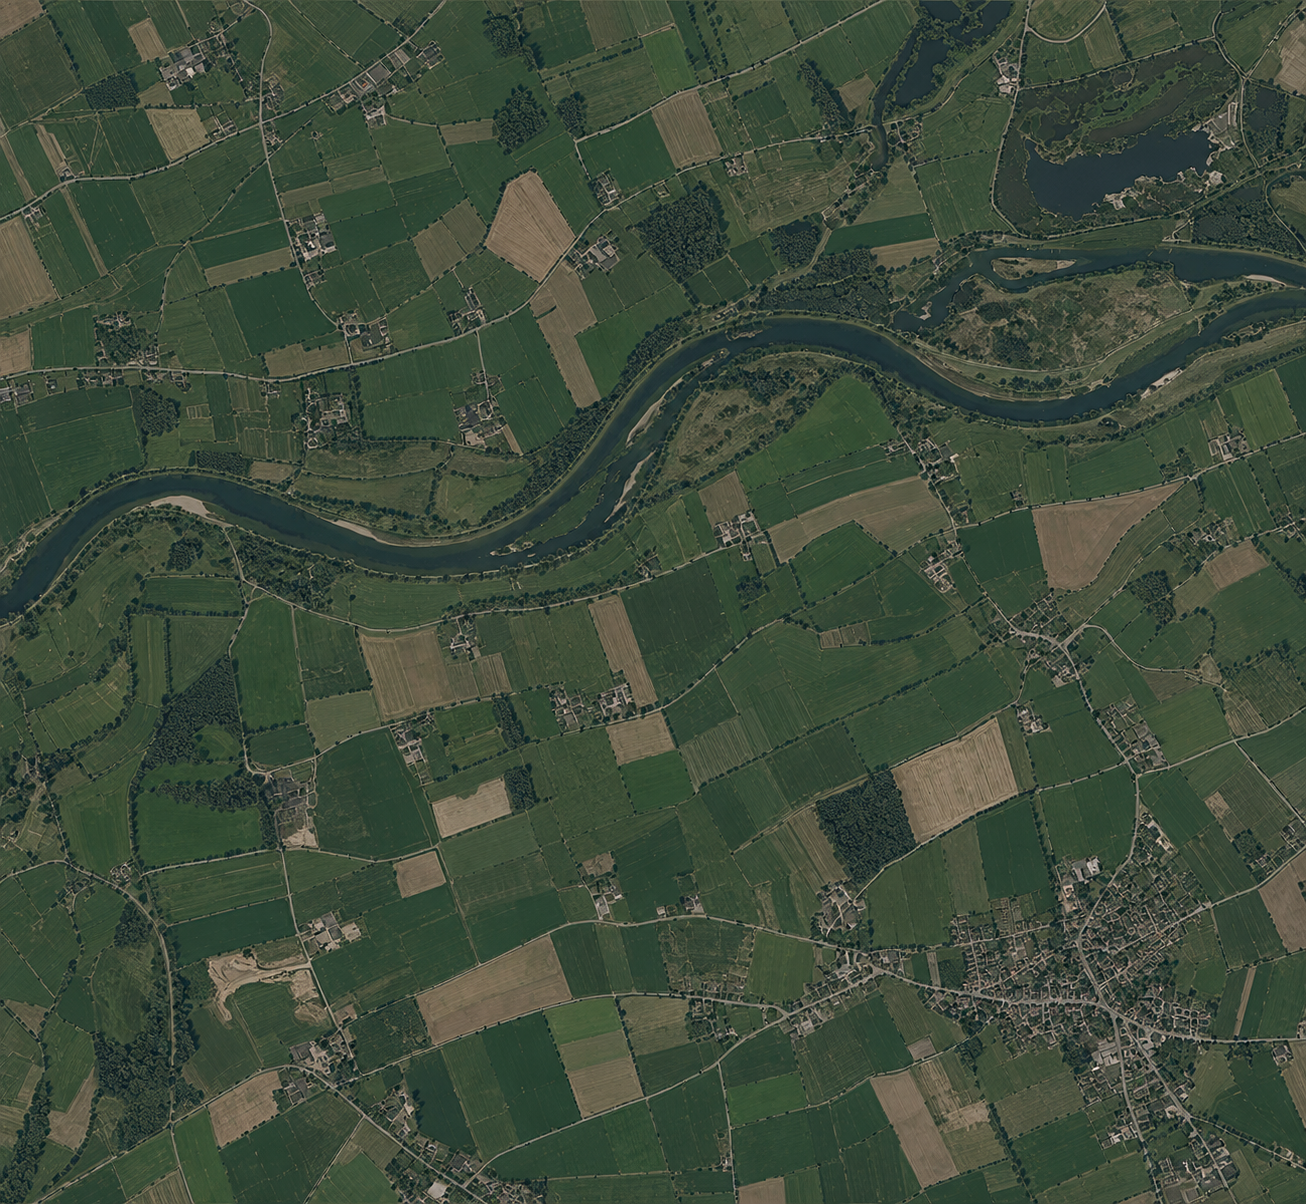
1 of 3
Stikstof Module
One overview for the conversation about the area
Share one traceable picture with the collective, adviser and government. That supports the joint conversation and the choice of next steps. This complements existing instruments. It is not a legal deposition calculation and not a basis for permitting.
- Share one picture with collective, adviser and government
- A joint conversation about the area
- Targeted next steps, not permit evidence
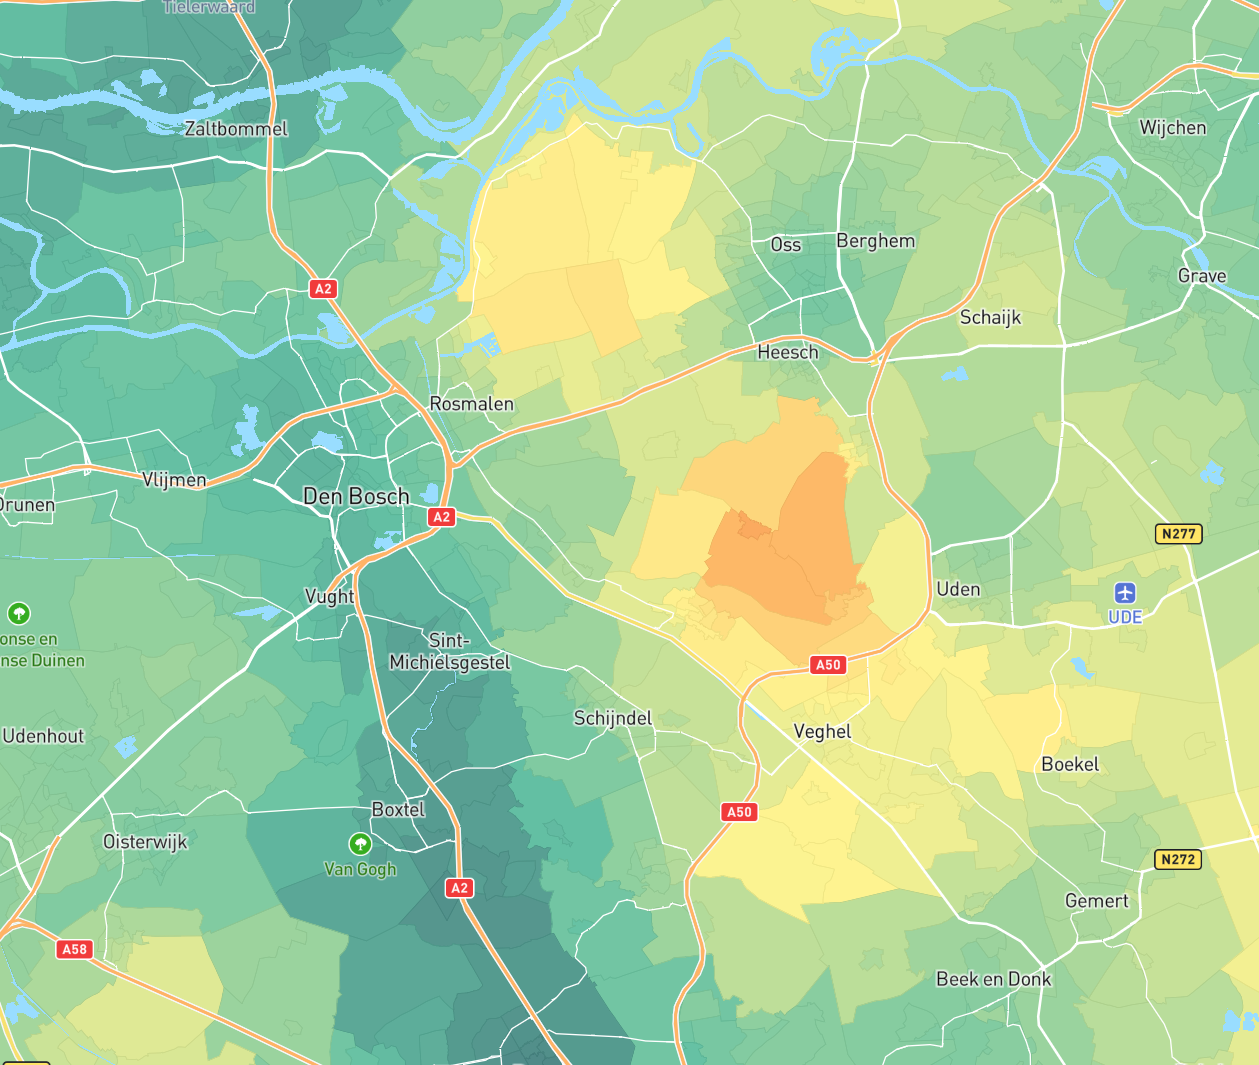
Follow ammonia with the Stikstof Module
Measurements in the area, registered measures and the trend against the background. One picture for collective and adviser.
Follow ammonia with the Stikstof Module
Measurements in the area, registered measures and the trend against the background. One picture for collective and adviser.