Energy
Emission insight for energy and infrastructure
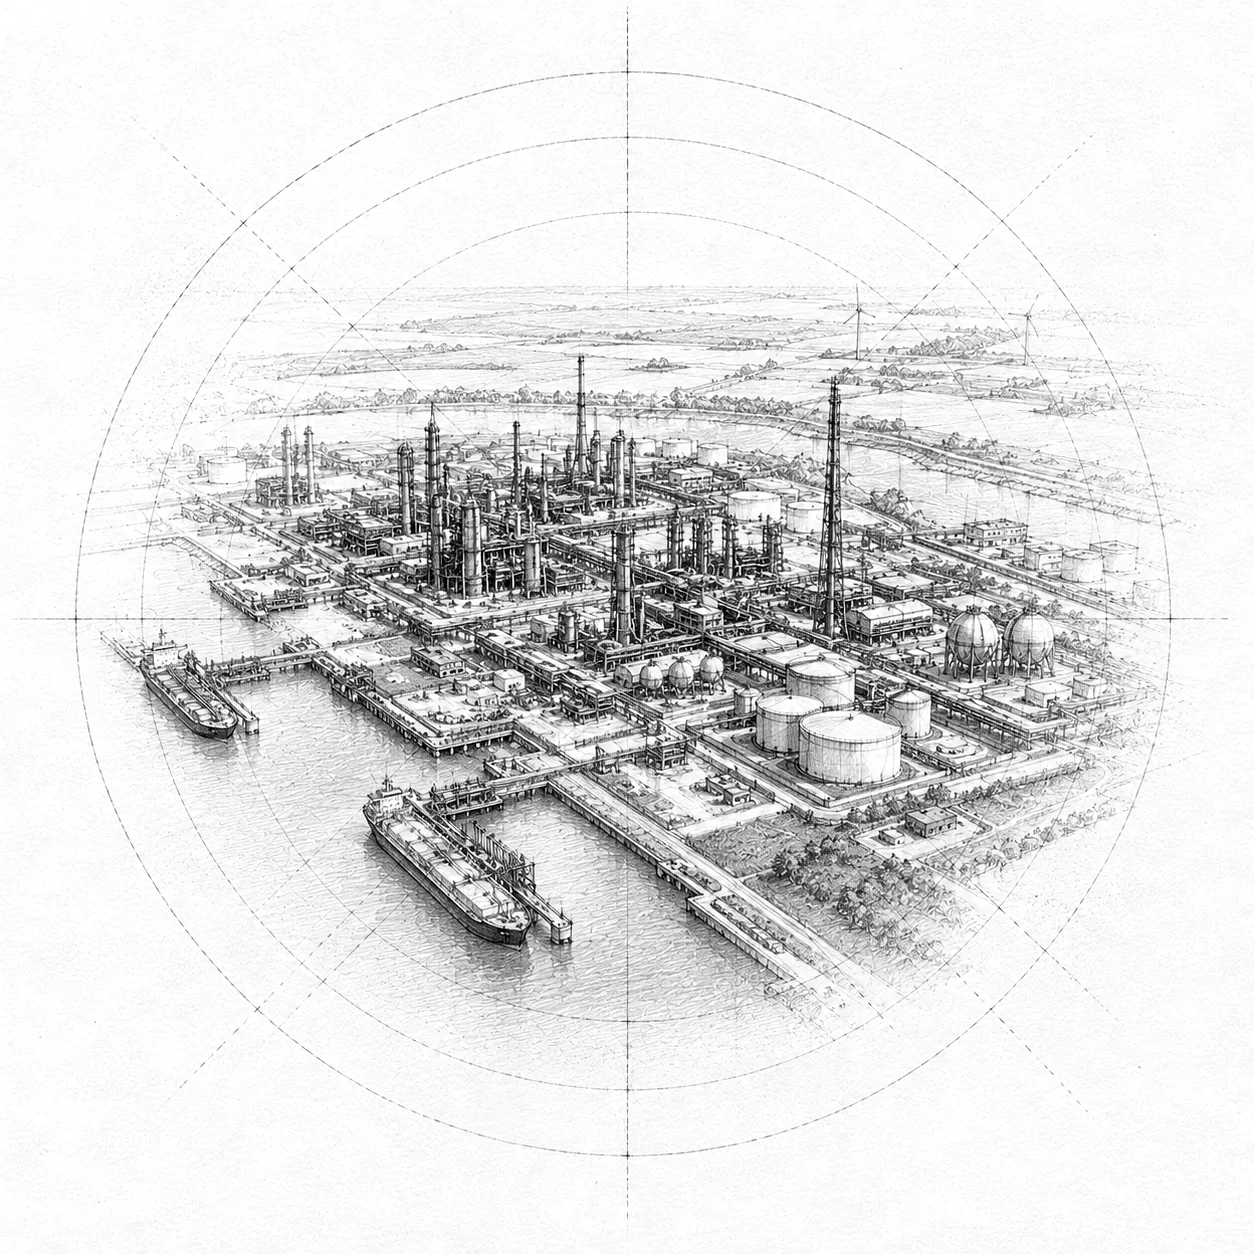
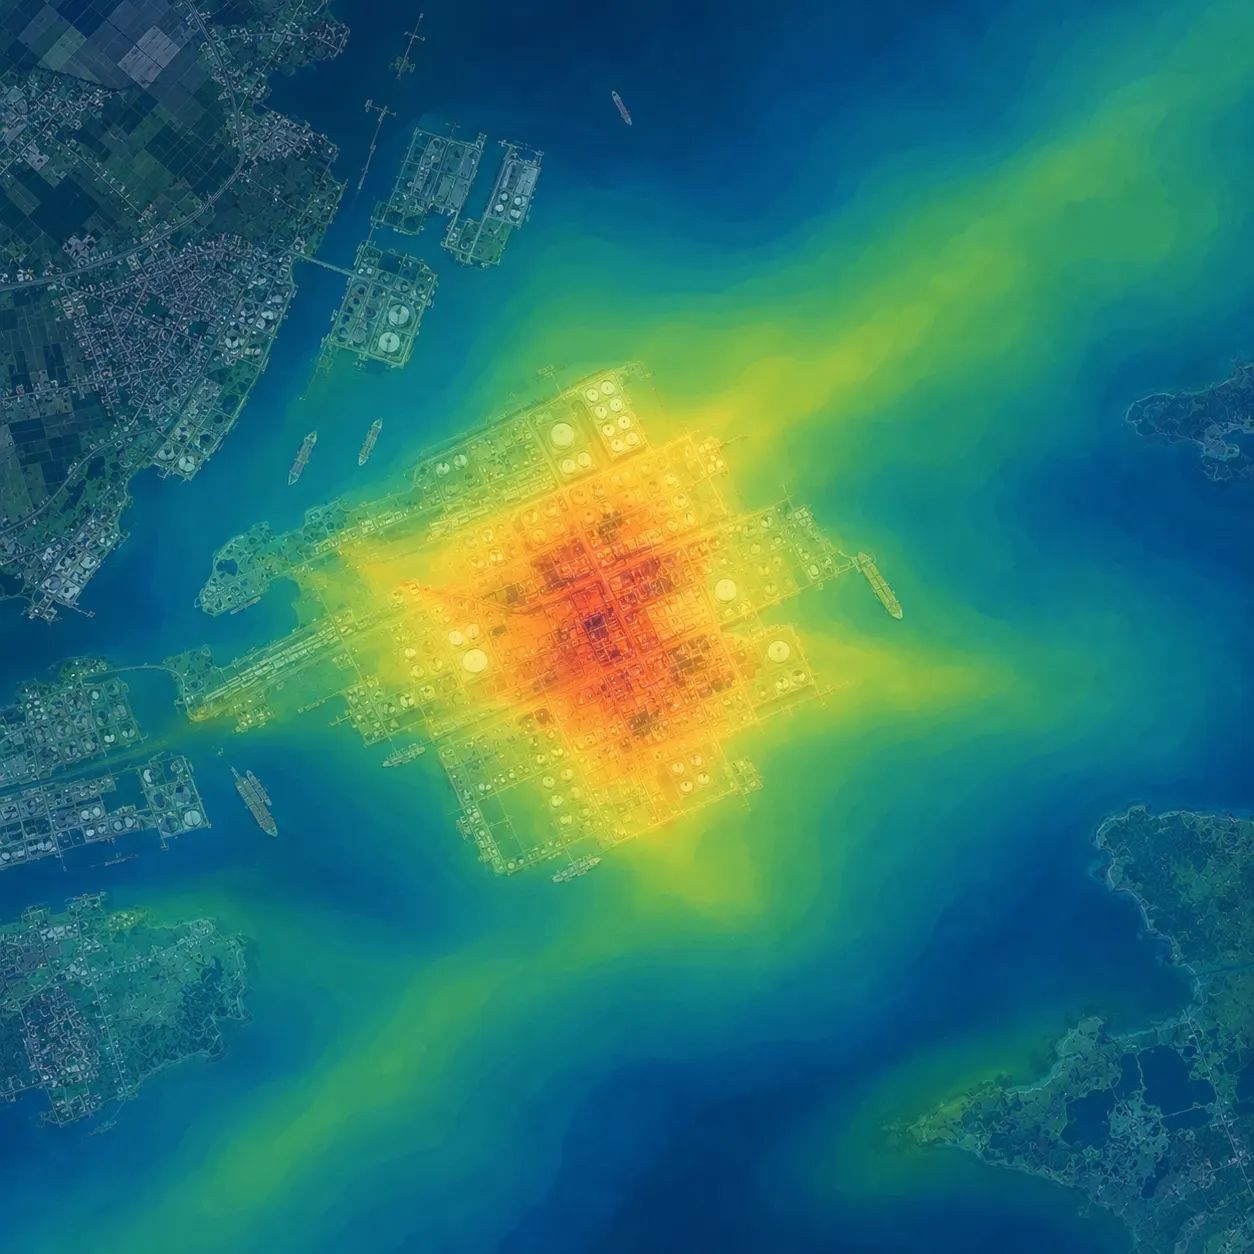
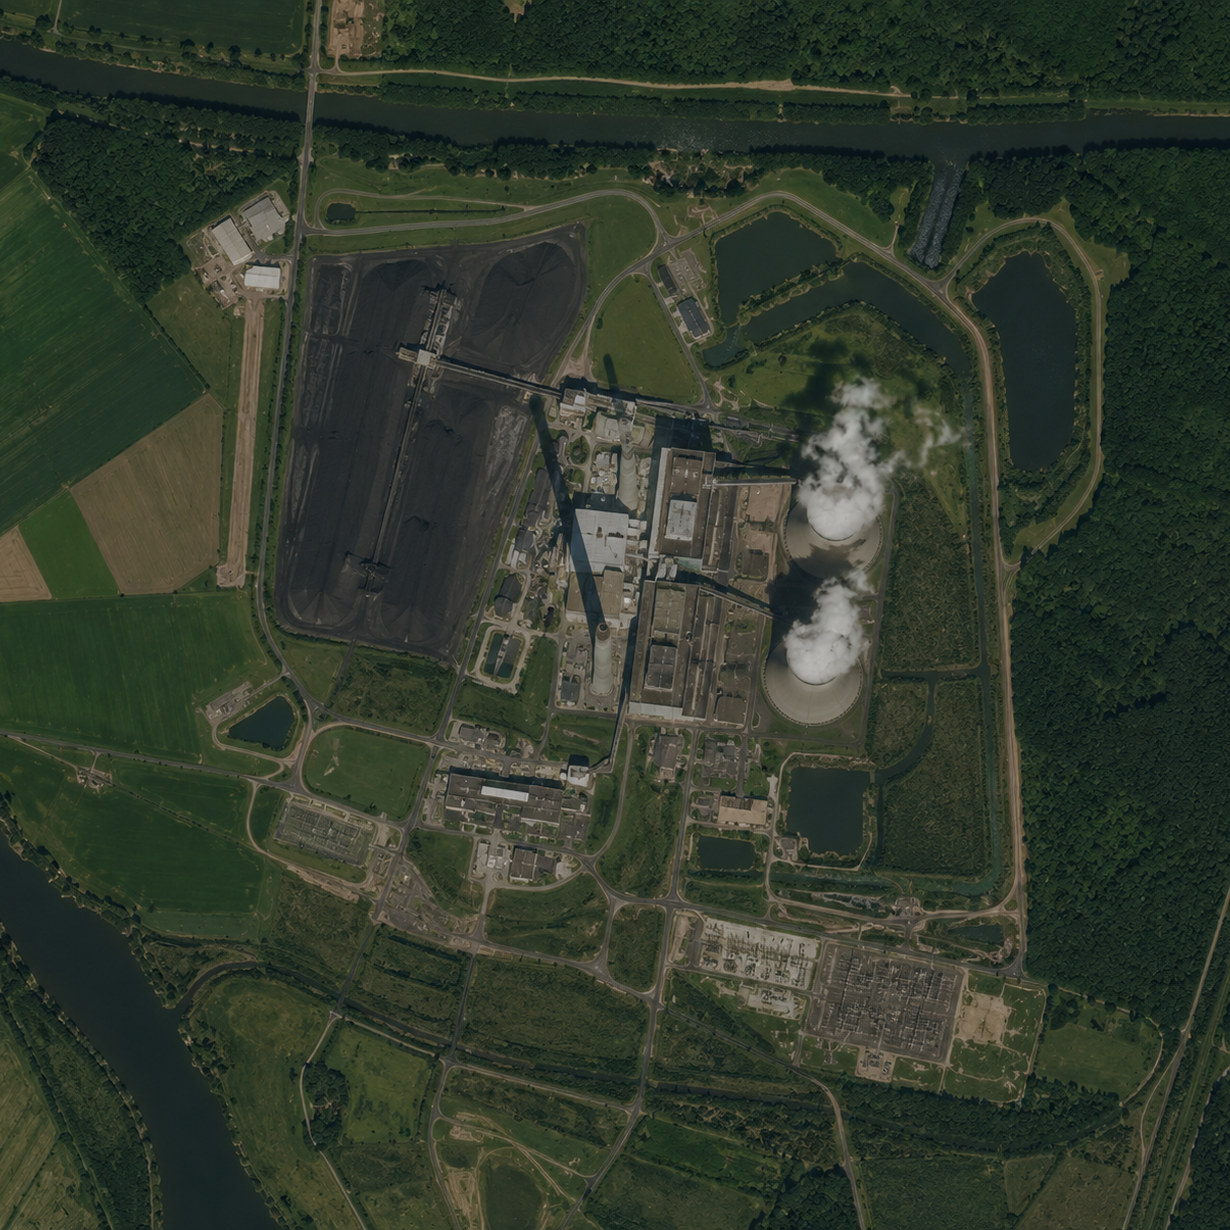
Follow CO₂ signals around production sites and networks. Carbon Eye is being developed to set reported emissions next to satellite observations. First results are expected in 2026.
- See emission hotspots around installations and sites
- Follow trends for inspection
- Compare sites worldwide
CO₂
Hotspot detected
Detection
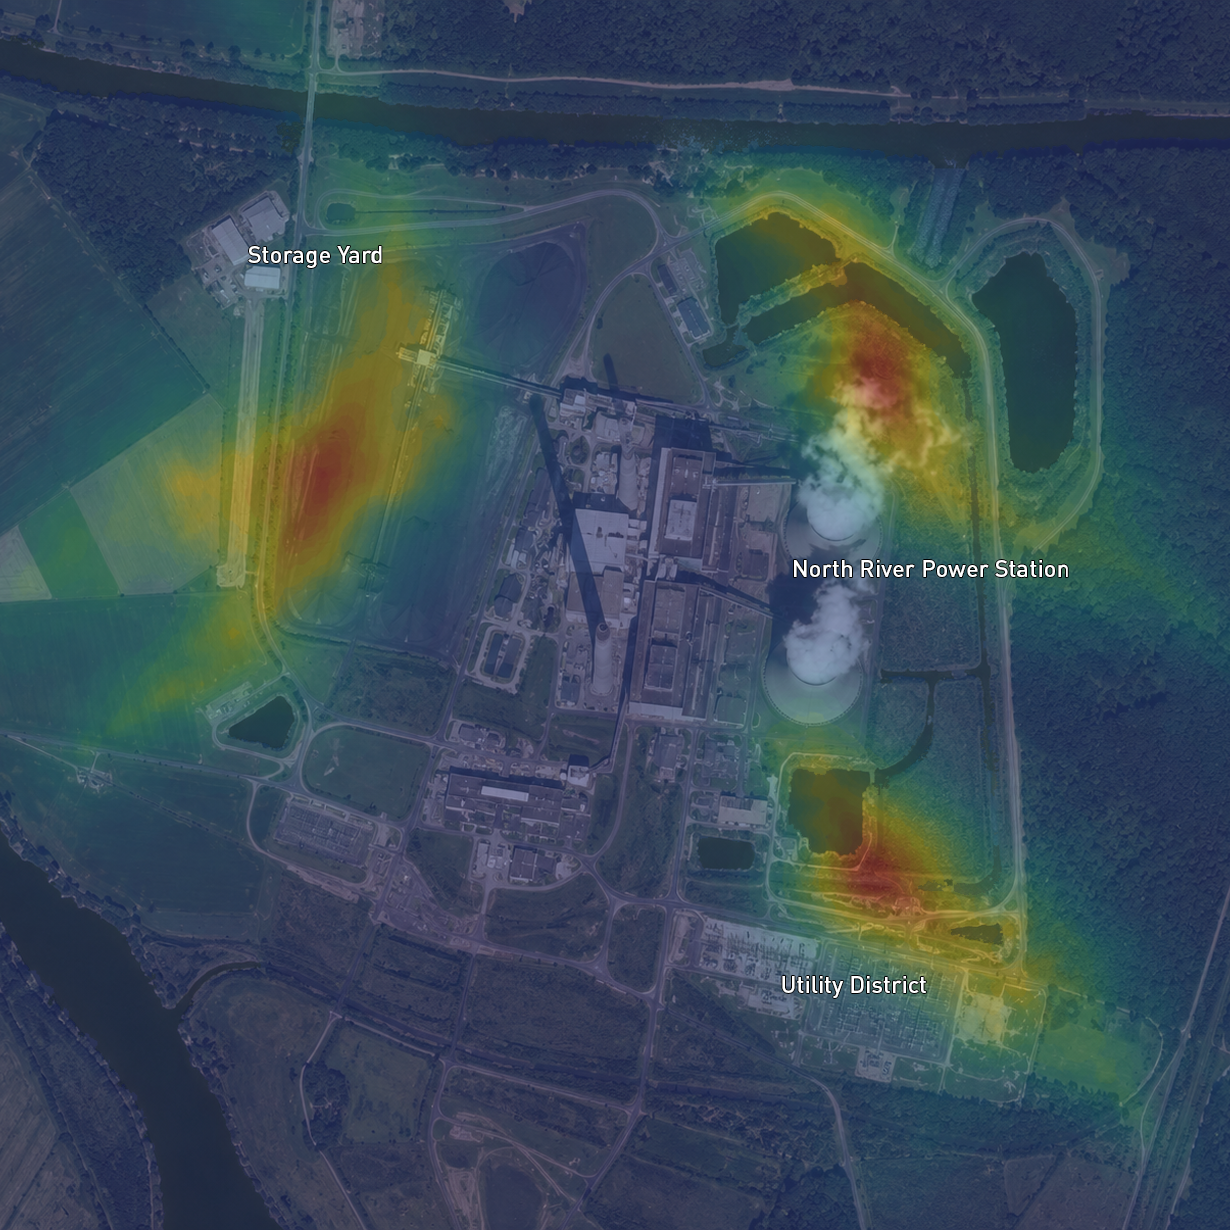
Detect leaks and hotspots more easily
See CO₂ hotspots around production sites and networks. Combine satellite detection with your own sensors so you can decide more quickly where inspection is needed.
- See emission hotspots around installations and sites
- Follow trends for inspection
- Compare sites worldwide
Reporting
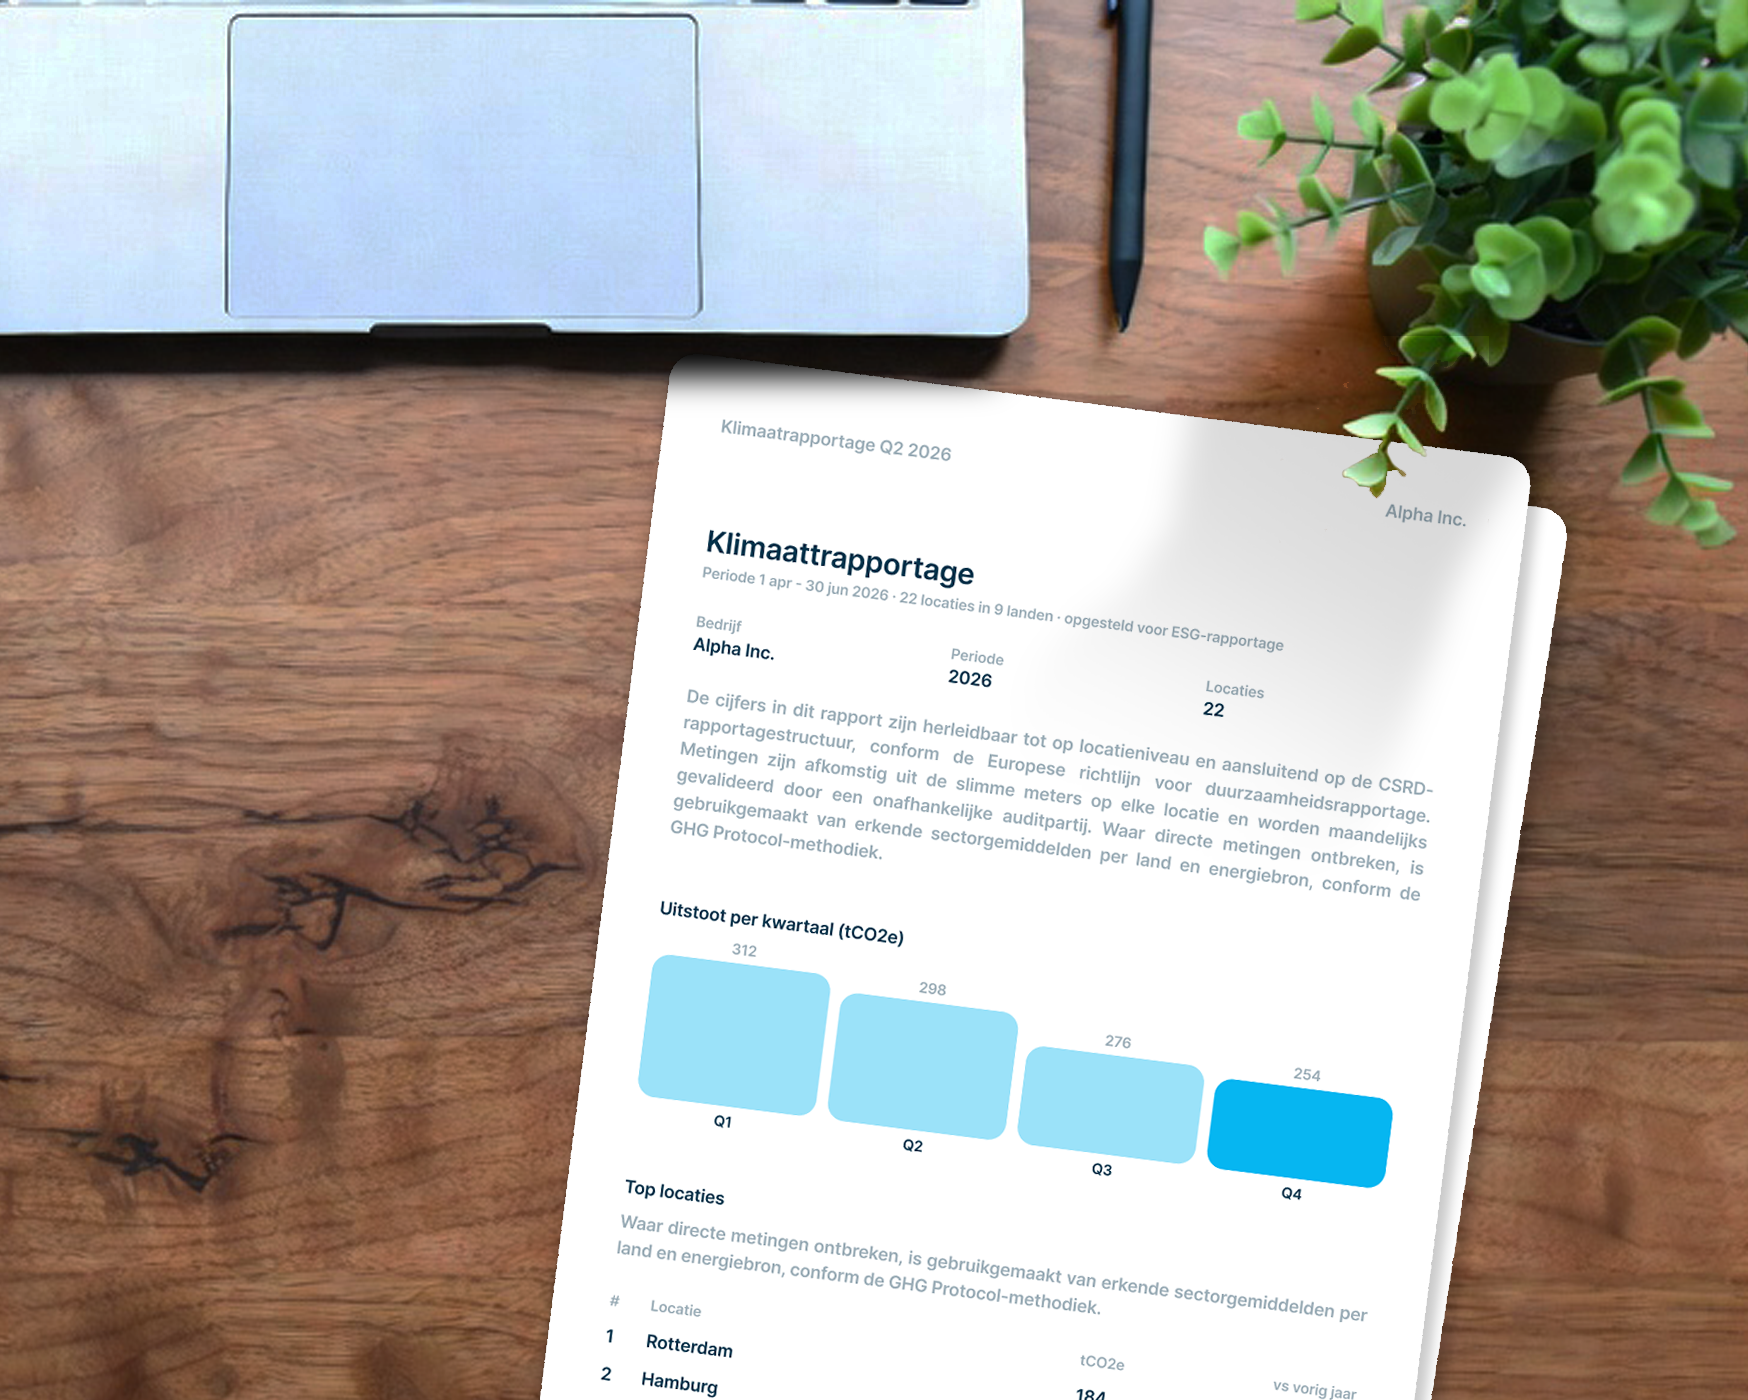
Underpin your reports with traceable data
Climate and compliance reports need traceable figures, not only annual estimates. Deliver consistent time series per location, compare installations and years, and connect to ESG and CSRD workflows via export or API.
- Periodic exports for climate and ESG reports
- Compare production sites and years on the same basis
- API connection to existing ESG and compliance tools
Carbon Eye
CO₂ claims next to satellite observations
Carbon Eye is being developed to set reported CO₂ next to satellite observations, per installation or site. That comparison is not available yet.
- Focused on CO₂
- Comparison in development
- First results expected in 2026
1 of 3
See Carbon Eye for your sites
Carbon Eye sets reported CO₂ next to satellite data around installations. The product is in development. First results are expected in 2026.
See Carbon Eye for your sites
Carbon Eye sets reported CO₂ next to satellite data around installations. The product is in development. First results are expected in 2026.